
Key points and practice for this topic.
Enzymes
Detailed WJEC AS Biology notes on that build up from the basics: , protein structure, , , , factors affecting , , and both specified practicals.
On this page
What is metabolism?
Every living cell is busy. Inside a single cell, thousands of chemical reactions are happening at the same time. Some reactions break large molecules down to release energy. Others build large molecules, such as proteins and DNA, from smaller ones. All of the chemical reactions that happen in a cell or an organism are called .
Most of these reactions do not happen on their own. They are linked together in a sequence called a . The of the first reaction becomes the starting molecule for the second reaction, the of the second reaction becomes the starting molecule for the third, and so on.
The important point for this topic is that every single step in a is controlled by its own . That is exactly what the specification means when it describes as a series of controlled reactions.
A simple with three
- 1. Molecule A is the starting
- 2. 1 converts A into B
- 3. 2 converts B into C
- 4. 3 converts C into the final D
A simple way to picture this is a sandwich shop production line. One person slices the bread, the next adds the filling and the last one wraps it. If the person adding the filling is off sick, sliced bread piles up and no finished sandwiches come out. A behaves in the same way. If 2 is missing or not working, molecule B builds up and molecules C and D are not made.
Scroll sideways to view all columns.
| Term | What it means | Example |
|---|---|---|
| The molecule that an acts on | Starch is the of | |
| The molecule or molecules made by the reaction | Maltose is the when breaks down starch | |
| A substance that speeds up a chemical reaction without being used up | An can be used again and again | |
| A made of protein | , , |
You will meet many controlled pathways later in the course, including respiration and photosynthesis in Unit 3 and DNA replication in the nucleic acids topic. For now, the idea to hold on to is simple: no , no .
What are enzymes made of?
are proteins. To understand how work, you first need a quick reminder of how proteins are built, because the shape of the protein is what makes an work.
A protein is made from amino acids joined together by peptide bonds in condensation reactions. There are 20 different amino acids. They differ only in their , which is the variable part of the molecule. Some carry a positive or negative charge, some are polar and some are non-polar.
How a chain of amino acids becomes a working
- 1. : the sequence of amino acids in the polypeptide chain
- 2. Secondary structure: parts of the chain coil into alpha helices or fold into beta pleated sheets, held by hydrogen bonds
- 3. : the whole chain folds into a precise three dimensional shape, held by hydrogen bonds, ionic bonds, disulfide bonds and hydrophobic interactions between
- 4. Quaternary structure (only in some ): two or more polypeptide chains join together
are . This means the chain is folded into a compact, roughly spherical shape. Most of the hydrophilic (water loving) face outwards, so are soluble. This lets them dissolve in the cytoplasm of a cell or in digestive juices, where they can meet their .
Here is the chain of cause and effect that the rest of this topic depends on. The sequence of amino acids decides where the bonds form. Where the bonds form decides the . The decides the exact shape of the , which is the part of the where the binds. So if one important amino acid is swapped for a different one, the can end up the wrong shape and the may stop working.
Why the matters
- 1. Sequence of amino acids
- 2. Position of hydrogen, ionic and disulfide bonds
- 3. (three dimensional shape)
- 4. Shape of the
- 5. Which the can bind
Do enzymes work inside or outside cells?
All are made inside cells, on , during protein synthesis. What differs is where they go on to do their job. Biologists sort into two groups depending on where they act.
act inside the cell that made them. Many are dissolved in the cytoplasm, some are inside and some are attached to membranes. For example, breaks down hydrogen peroxide, a toxic by- of , into water and oxygen before it can damage the cell. DNA polymerase works inside the , and the of respiration work in the cytoplasm and .
are made inside the cell but are then secreted out of it by exocytosis, so they act outside the cell. is made by cells in the salivary glands but works in the mouth. Trypsin is made in the pancreas but works in the small intestine. is secreted into tears and saliva.
Scroll sideways to view all columns.
| Feature | Intracellular enzymes | Extracellular enzymes |
|---|---|---|
| Where they are made | Inside the cell, on | Inside the cell, on |
| Where they act | Inside the same cell | Outside the cell that made them |
| How they get to where they act | They stay in the cell | They are secreted by exocytosis |
| Examples | , DNA polymerase, of respiration | , trypsin, in tears |
A simple example of why are useful is mould growing on a slice of bread. The fungus cannot swallow the bread. Instead, its hyphae secrete onto the bread. The break the large starch and protein molecules into small soluble molecules, which the fungus then absorbs. You will meet this again as saprotrophic nutrition in Unit 2.
What is an active site and why are enzymes specific?
When an folds into its , a small region of its surface forms a pocket or groove. This region is called the . It is made from only a few of the 's amino acids, but their are positioned very precisely so that they can bind to the .
The shape of the is to the shape of the . means the two shapes fit together, a bit like two neighbouring jigsaw pieces. The charges on the in the also match up with charges on the , which helps it bind.
and molecules move around randomly. A reaction can only happen when a molecule collides with the the right way round. When this happens it is called a , and the binds to form an .
The steps of an controlled reaction
- 1. and collide
- 2. binds to the , forming an
- 3. The reaction happens while the is held in the , forming an
- 4. The are released
- 5. The is unchanged and its is free to bind another molecule
Because each has an with a particular shape, only one type of , or a small group of very similar , will fit. We say are . For example, the tyrosinase converts the amino acid tyrosine into the pigment melanin. Other amino acids do not have a shape that is to its , so tyrosinase cannot act on them.
The simplest model of how this works is the . The is like a key and the is like a lock. Only the correctly shaped key fits the lock. This model is useful for explaining , but it treats the as completely rigid. The next section shows why scientists now think the is slightly flexible.
What is the induced fit theory?
The suggests the is a fixed, rigid shape. Evidence from studying structures shows that this is not quite true. The can change shape slightly. The explains action using this idea.
In the , the is not an exact fit for the to begin with. As the enters the , the changes shape slightly and moulds itself tightly around the . The has induced, or caused, the change in shape. This tighter fit puts strain on particular bonds in the , which makes them easier to break. This is one way an lowers the of the reaction.
A good everyday example is a woollen glove. When it is lying on a table it is roughly hand shaped but floppy. When you push your hand in, the glove stretches and fits closely around your fingers. The behaves in a similar way when the enters.
Scroll sideways to view all columns.
| Feature | Lock and key model | Induced fit theory |
|---|---|---|
| Shape of the before binding | Exactly to the | Close to , but not an exact fit |
| What happens when the binds | Nothing changes shape | The changes shape slightly to mould around the |
| Effect on bonds in the | Not explained by the model | Bonds are put under strain, so they break more easily |
| How well it matches evidence | Too simple | Better supported by evidence |
The specification uses to illustrate . is an found in tears, saliva and mucus. It helps to defend the body against bacteria. It works by hydrolysing in the long polysaccharide chains that make up bacterial cell walls. means breaking a bond by adding water.
The of is a long groove. When part of a polysaccharide chain from the cell wall fits into the groove, the changes shape and closes slightly around it. This distorts one of the sugar units in the chain and puts strain on a . The strained bond is then , splitting the chain.
How destroys a bacterium
- 1. A polysaccharide chain from the bacterial cell wall enters the groove shaped
- 2. The changes shape and closes around the chain ()
- 3. A in the chain is put under strain
- 4. The bond is and the chain is split
- 5. The cell wall is weakened
- 6. Water enters the bacterium by and the cell bursts
The final step links to from the membranes topic. The cytoplasm of the bacterium has a lower (more negative) water potential than the tears or saliva around it. Normally the strong cell wall stops the cell from bursting as water moves in. Once has weakened the wall, water moves into the cell by and the cell bursts.
How do enzymes speed up reactions?
means speeding up a chemical reaction using a . The is not used up and is not permanently changed by the reaction, so it can be used again. are biological catalysts.
To understand how speed up reactions, you need the idea of . is the minimum amount of energy that must be supplied to start a reaction, so that bonds in the can break.
Think of pushing a heavy trolley over a small hump before it can roll down a on the other side. Even though the trolley ends up lower down, you still have to push it up and over the hump first. is like that hump.
Many reactions in cells have a high . At body temperature, very few molecules have enough energy to get over this barrier, so the reaction would be far too slow to keep the organism alive. Heating the cell to give molecules more energy is not an option, because high temperatures would its proteins.
solve this problem by providing a different route for the reaction that has a lower . With a lower barrier to get over, many more molecules can react at body temperature, so the reaction happens much faster.
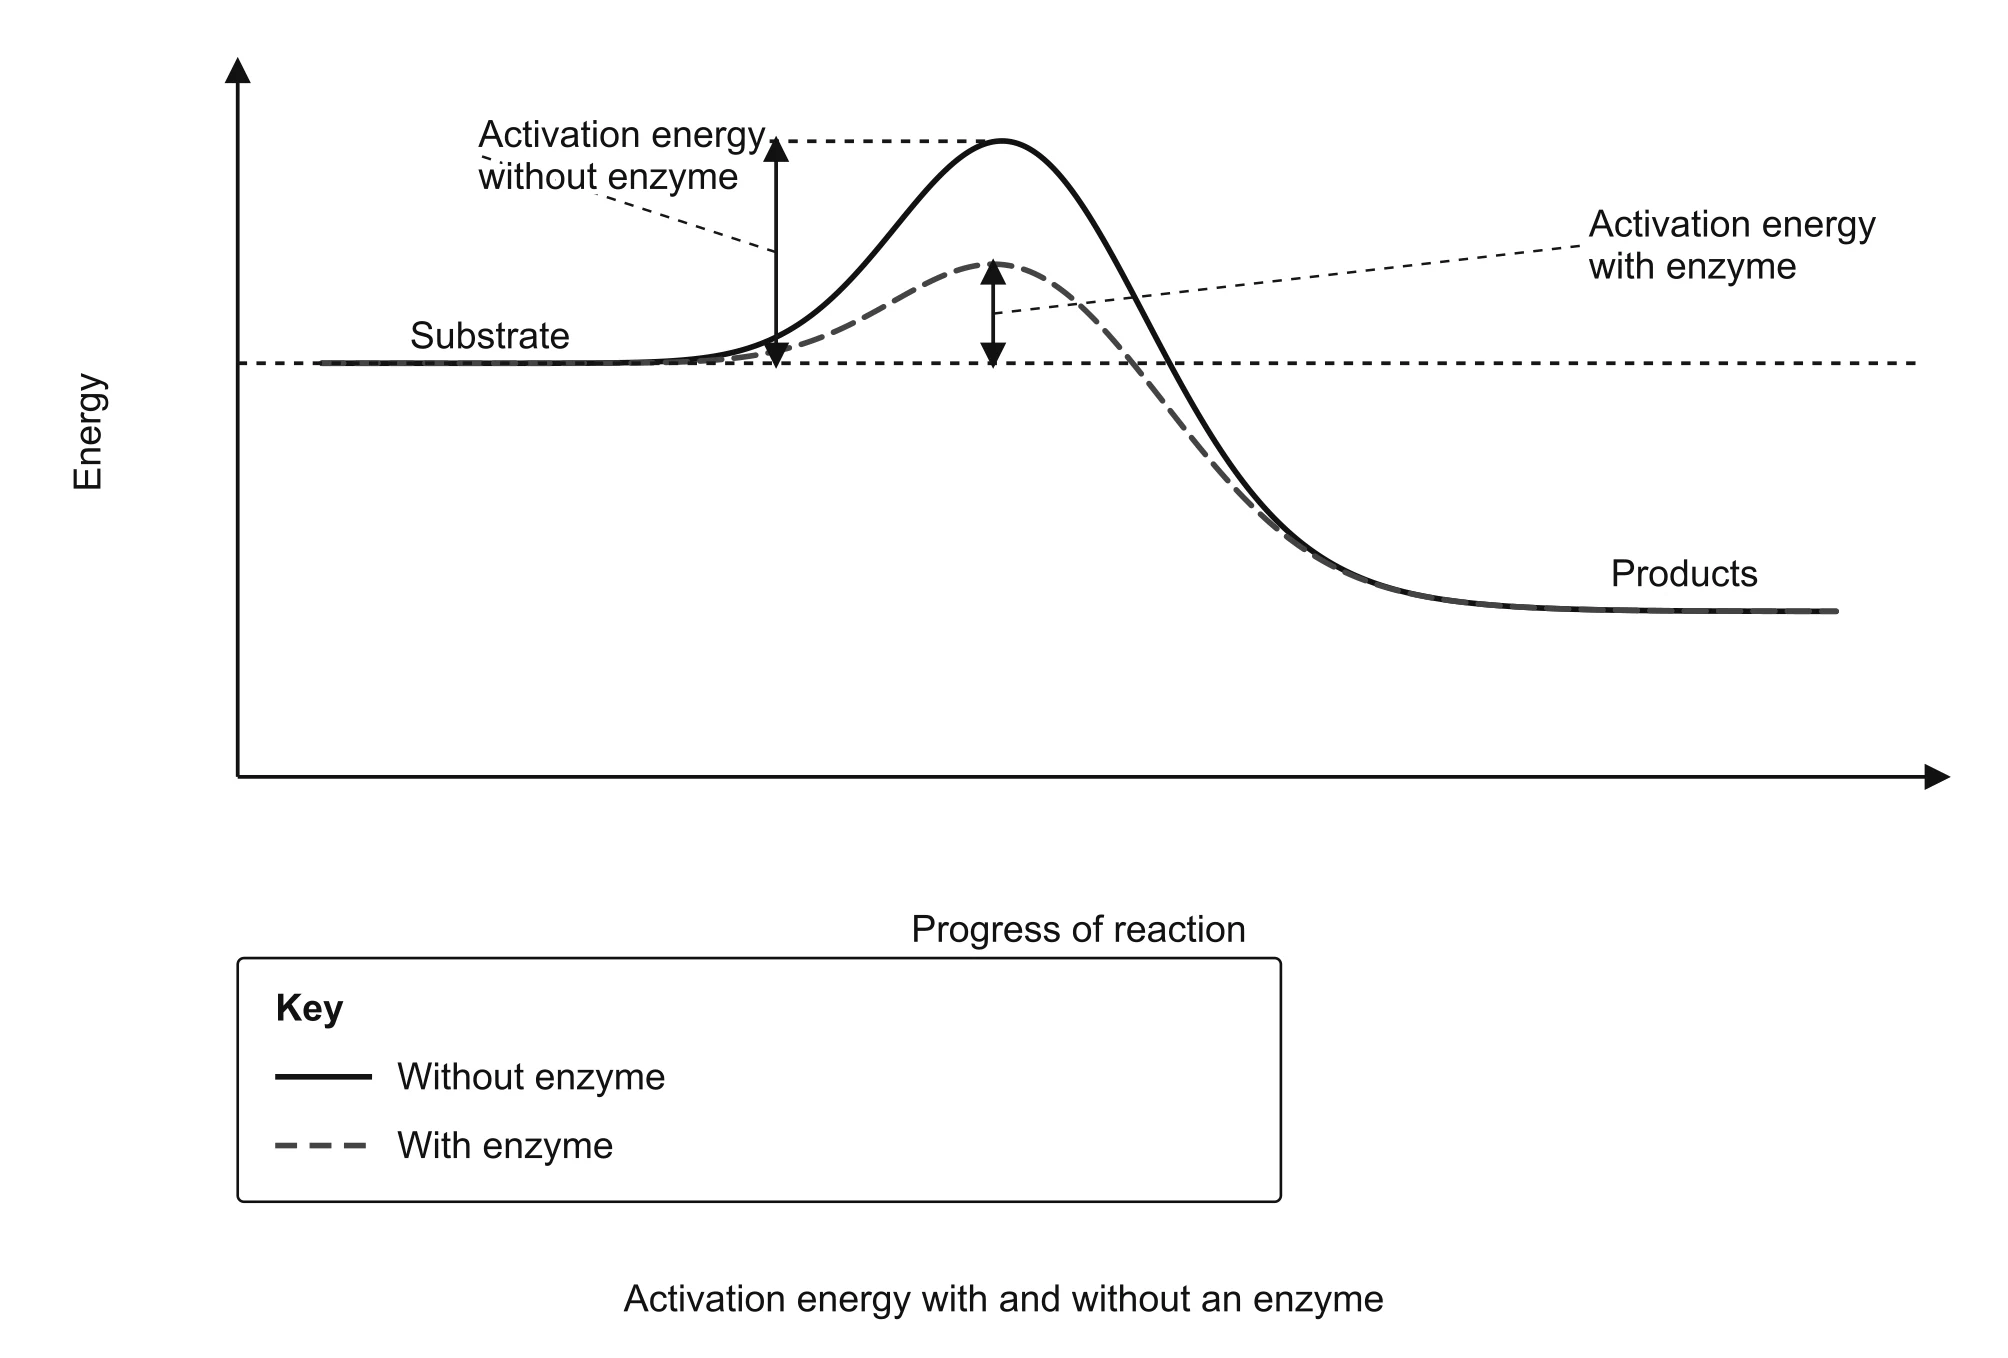
The graph below is the standard way of showing this. Read through the steps underneath it carefully, because WJEC has asked candidates both to label this kind of graph and to draw the curve onto it.
 Open full size
 - The x axis shows the progress of the reaction, from on the left to on the right. There are no numbers because it simply shows the order of events.
- The y axis shows the energy stored in the molecules.
- Both curves start at the same energy level. This is the energy of the , and it does not change when an is added.
- Both curves go up over a hump before coming down. The height from the level to the top of the hump is the .
- The solid curve is the reaction without an . Its hump is tall, so its is large.
- The dashed curve is the same reaction with an . Its hump is much lower, so its is smaller.
- Both curves finish at the same, lower energy level. This is the energy of the . Because the have less energy than the , this reaction releases energy.
- The difference in energy between and is the same for both curves. The changes the route, not the start or the finish.
How does binding in the lower the ? When are held in the , they are brought close together in the right position to react. In the , the also moulds around the and puts strain on bonds, which makes them easier to break. Both of these effects less energy is needed to start the reaction.
is a good example of why this matters. Hydrogen peroxide is made during respiration and is toxic. It does break down on its own, but very slowly. lowers the so that hydrogen peroxide is broken down into water and oxygen fast enough at body temperature to stop it building up and damaging cells.
How do we measure the rate of an enzyme reaction?
The of a reaction tells you how quickly it is happening. For an controlled reaction, is the amount of made, or the amount of used up, in a given amount of time. Before you can compare the effect of temperature, or concentration, you need to know how is measured.
Scroll sideways to view all columns.
| What you measure | Example | How rate is found |
|---|---|---|
| Volume of gas produced | releasing oxygen from hydrogen peroxide, collected in a gas syringe or an upturned measuring cylinder | Volume of gas divided by time, or the of a graph of volume against time |
| Time taken to reach an | Time until iodine stops turning blue-black when starch is broken down by , or time for a cloudy milk suspension to clear with trypsin | = 1 ÷ time |
| Change in colour measured with a | of a starch and iodine mixture falling as starch is digested | Change in divided by time |
| Time for a paper disc to sink and rise | Filter paper disc coated in dropped into hydrogen peroxide | = 1 ÷ time |
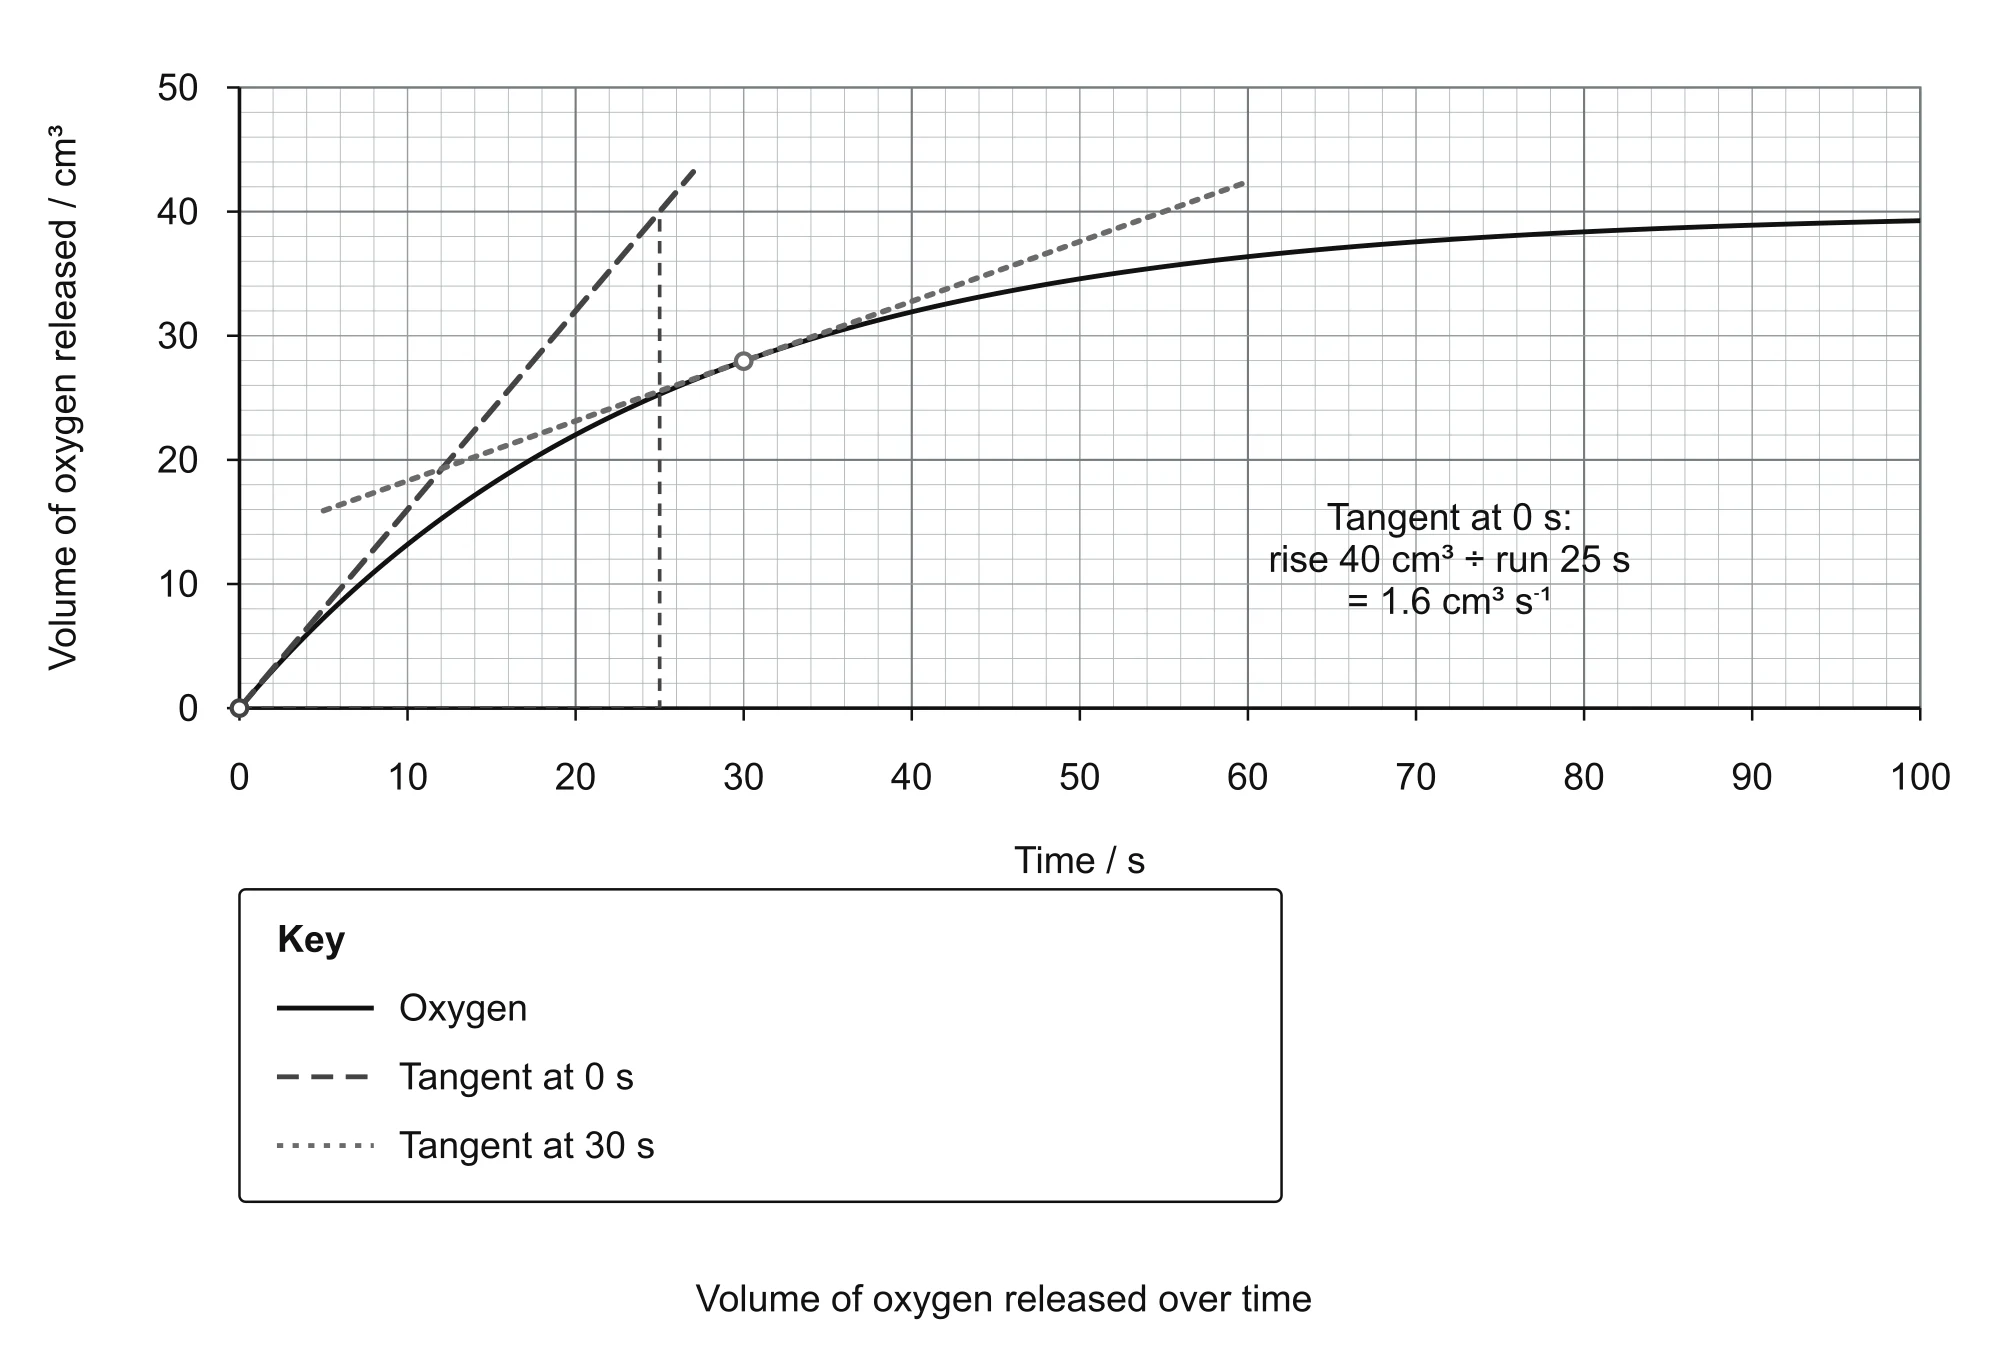
When you measure over time, you usually get a curve that is steep at the start and then levels off. The graph below shows an example: the volume of oxygen released when breaks down hydrogen peroxide.
 Open full size
 - At 0 seconds no oxygen has been released, so the curve starts at the origin.
- At the start the curve is steepest. This is when the concentration is highest, so there are the most and the most forming each second.
- As time goes on, hydrogen peroxide is used up. There are fewer molecules to collide with , so the slows and the curve becomes less steep.
- Eventually the curve becomes flat at about 40 cm³. This is because all of the has been used up. It is not because the has been used up, since are not used up in reactions.
- The dashed straight line is a drawn at 0 seconds. Its gives the , which is the fastest in the reaction.
- The dotted straight line is a drawn at 30 seconds. It is much less steep, which shows the has fallen by that time.
A is a straight line that just touches the curve at one point and has the same steepness as the curve at that point. To find the at a particular time, draw a at that time, choose two points on the that are far apart, and divide the change in the y value by the change in the x value.
How does temperature affect enzyme activity?
Temperature affects activity in two different ways. Up to a certain point it speeds reactions up. Beyond that point it damages the . The easiest way to understand this is to go through it in stages from cold to hot.
Stage 1, below the . As temperature rises, and molecules gain and move around faster. They collide more often, so there are more and more form each second. The increases.
Stage 2, the . The is the temperature at which the is highest. For many in the human body the is close to body temperature, about 37 °C. from other organisms can be very different. Some bacteria that live in hot springs have with an above 70 °C.
Stage 3, above the . The molecules now have so much that the vibrates strongly. This breaks the hydrogen bonds and ionic bonds that hold its in place. The changes, so the shape of the changes. The is no longer to the , so fewer can form and the falls quickly. The has been , and this change is permanent.
What about low temperatures? At low temperatures are rather than . The molecules have very little , so there are few collisions and few , but the shape of the is unchanged. If the temperature rises again, the works again. This is why freezing food slows down decay without destroying the .
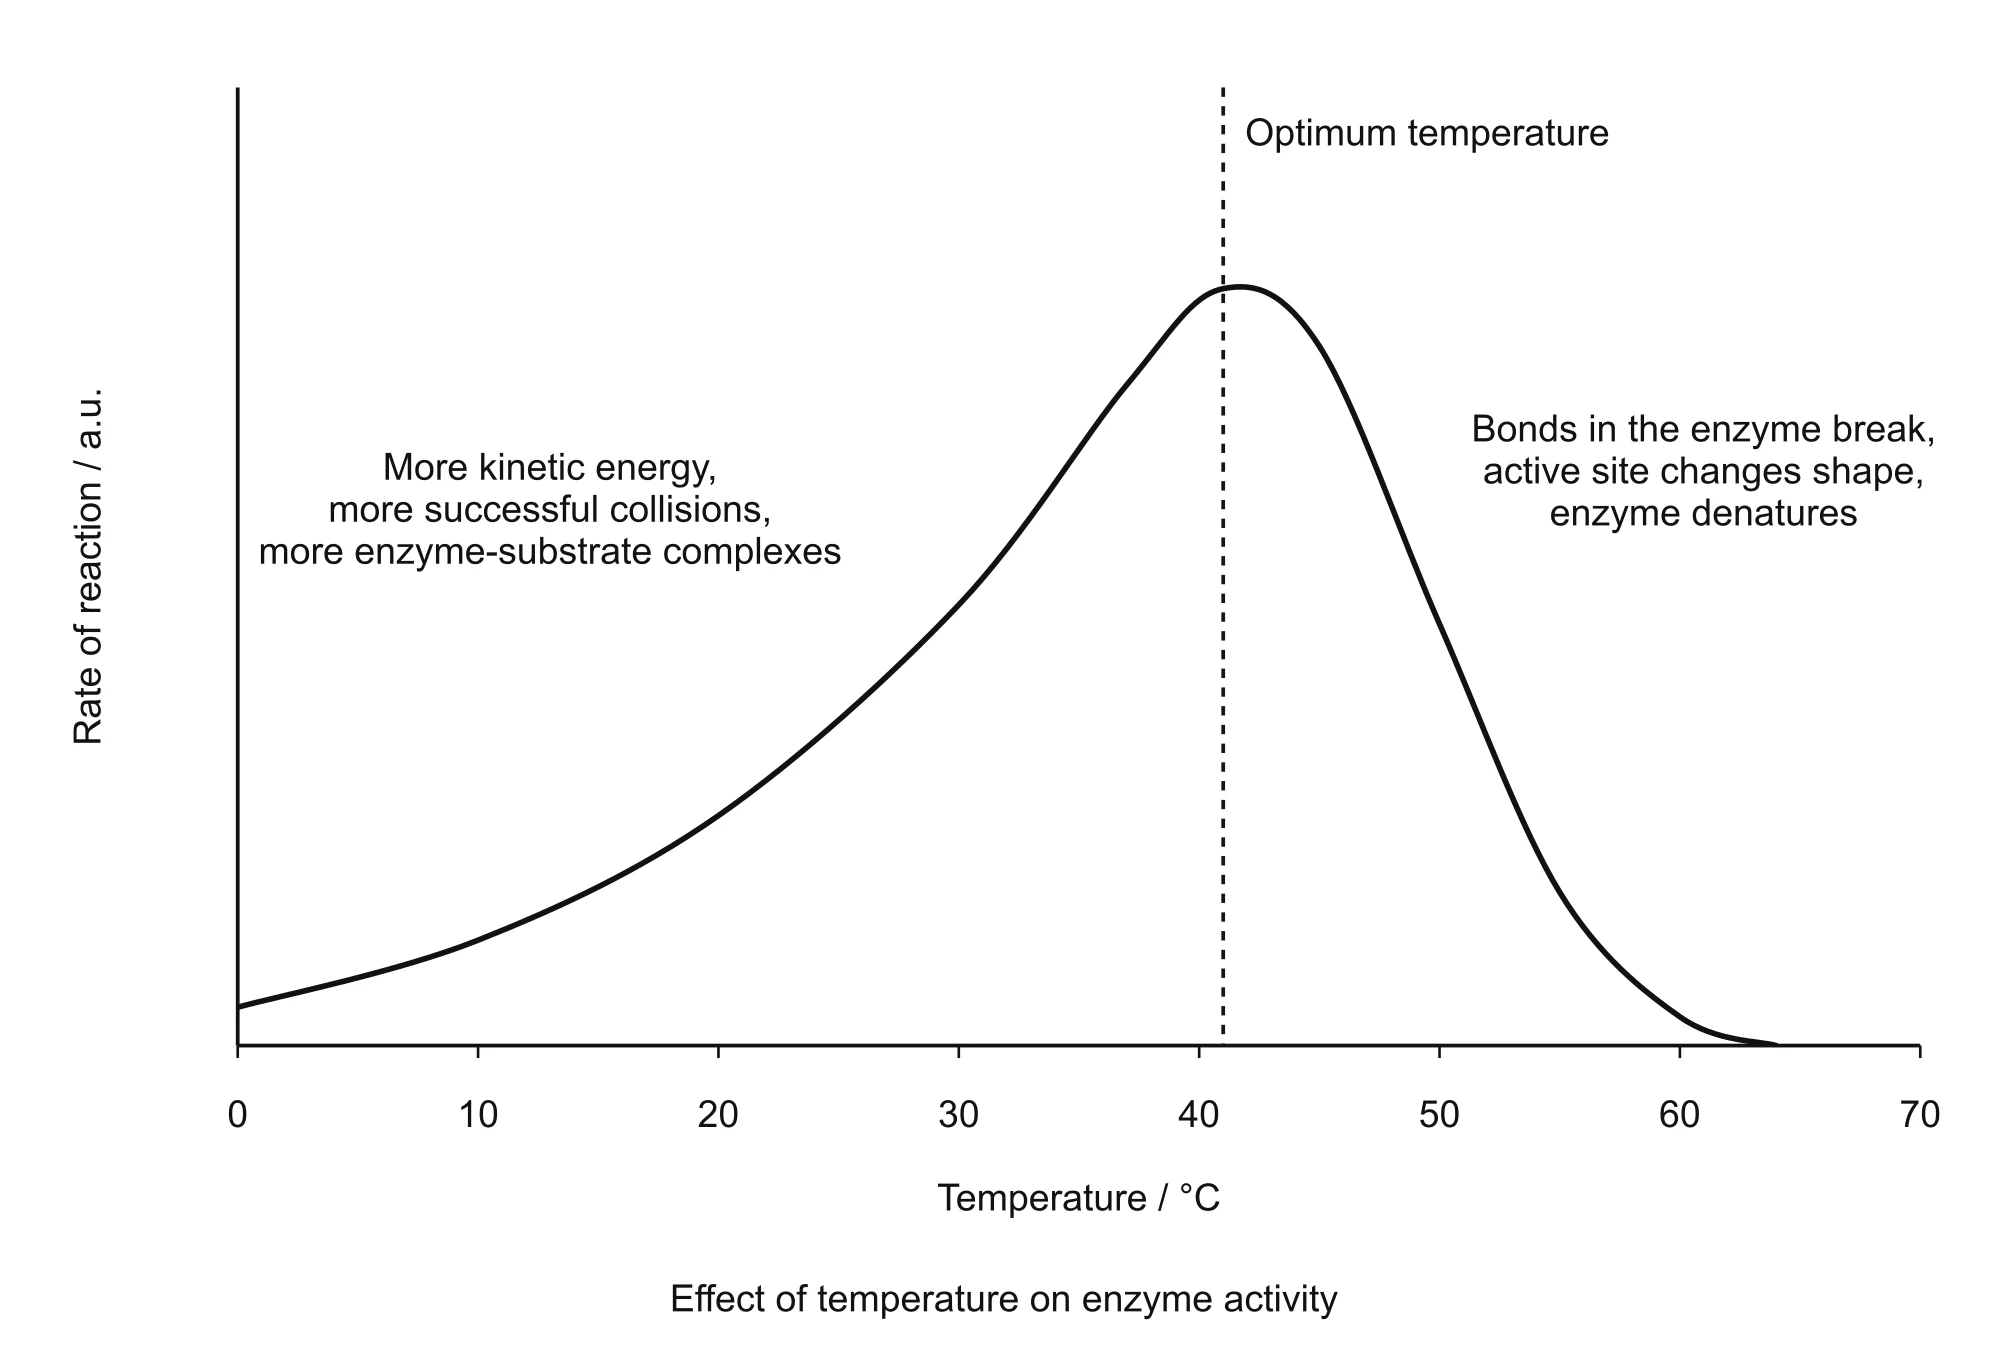
The graph below shows the typical shape. Work through the notes under it until you can explain every part of the curve.
 Open full size
 - The x axis shows temperature in °C. The y axis shows the in arbitrary units (a.u.), which means the values are relative rather than measured in a real unit.
- From 0 °C to about 40 °C the curve rises, slowly at first and then more steeply. This is the effect of increasing producing more .
- At about 40 °C the curve reaches its peak. This is the for this .
- Above 40 °C the curve falls much more steeply than it rose. happens quickly once bonds start to break, and it cannot be reversed.
- By about 60 °C the is almost zero because nearly all of the molecules have been .
- The curve is not symmetrical. It rises gradually and falls sharply. If you are asked to sketch it, show this difference.
Scroll sideways to view all columns.
| Feature | Below the optimum | At the optimum | Above the optimum |
|---|---|---|---|
| Low but increasing | High | Very high | |
| Shape of the | Unchanged | Unchanged | Changed, because bonds in the break |
| Increasing as temperature rises | Maximum number formed per second | Fewer, because no longer fits | |
| Can the recover? | Yes, it is only when cold | Not applicable | No, is permanent |
A memorable example comes from WJEC's 2025 paper. In Siamese cats, the tyrosinase makes the dark pigment melanin, but it is above 35 °C. The cat's ears, face, paws and tail are cooler than 35 °C, so tyrosinase works there and the fur is dark. The main part of the body is warmer than 35 °C, so tyrosinase is , little melanin is made and the fur is pale.
How does pH affect enzymes, and what does a buffer do?
is a measure of how acidic or alkaline a solution is. It depends on the concentration of hydrogen ions (H⁺). A low , such as 2, means a high concentration of hydrogen ions, so the solution is acidic. A high , such as 10, means a low concentration of hydrogen ions, so the solution is alkaline. 7 is neutral.
Remember that some amino acid carry electrical charges, and that ionic bonds and hydrogen bonds between help hold the together. Hydrogen ions and hydroxide ions interact with these charged groups. When the changes, the charges on the change.
This has two effects. First, the charges on the inside the change, so the may no longer be attracted to and held in the . Second, if the moves far from the , the ionic and hydrogen bonds holding the break, the changes shape and the is . Either way, fewer form and the falls.
Each has an at which its is highest. This usually matches the place where the works. Pepsin works in the stomach, which is very acidic, and has an of about 2. works in the mouth and has an of about 7. Trypsin works in the small intestine and has an of about 8.
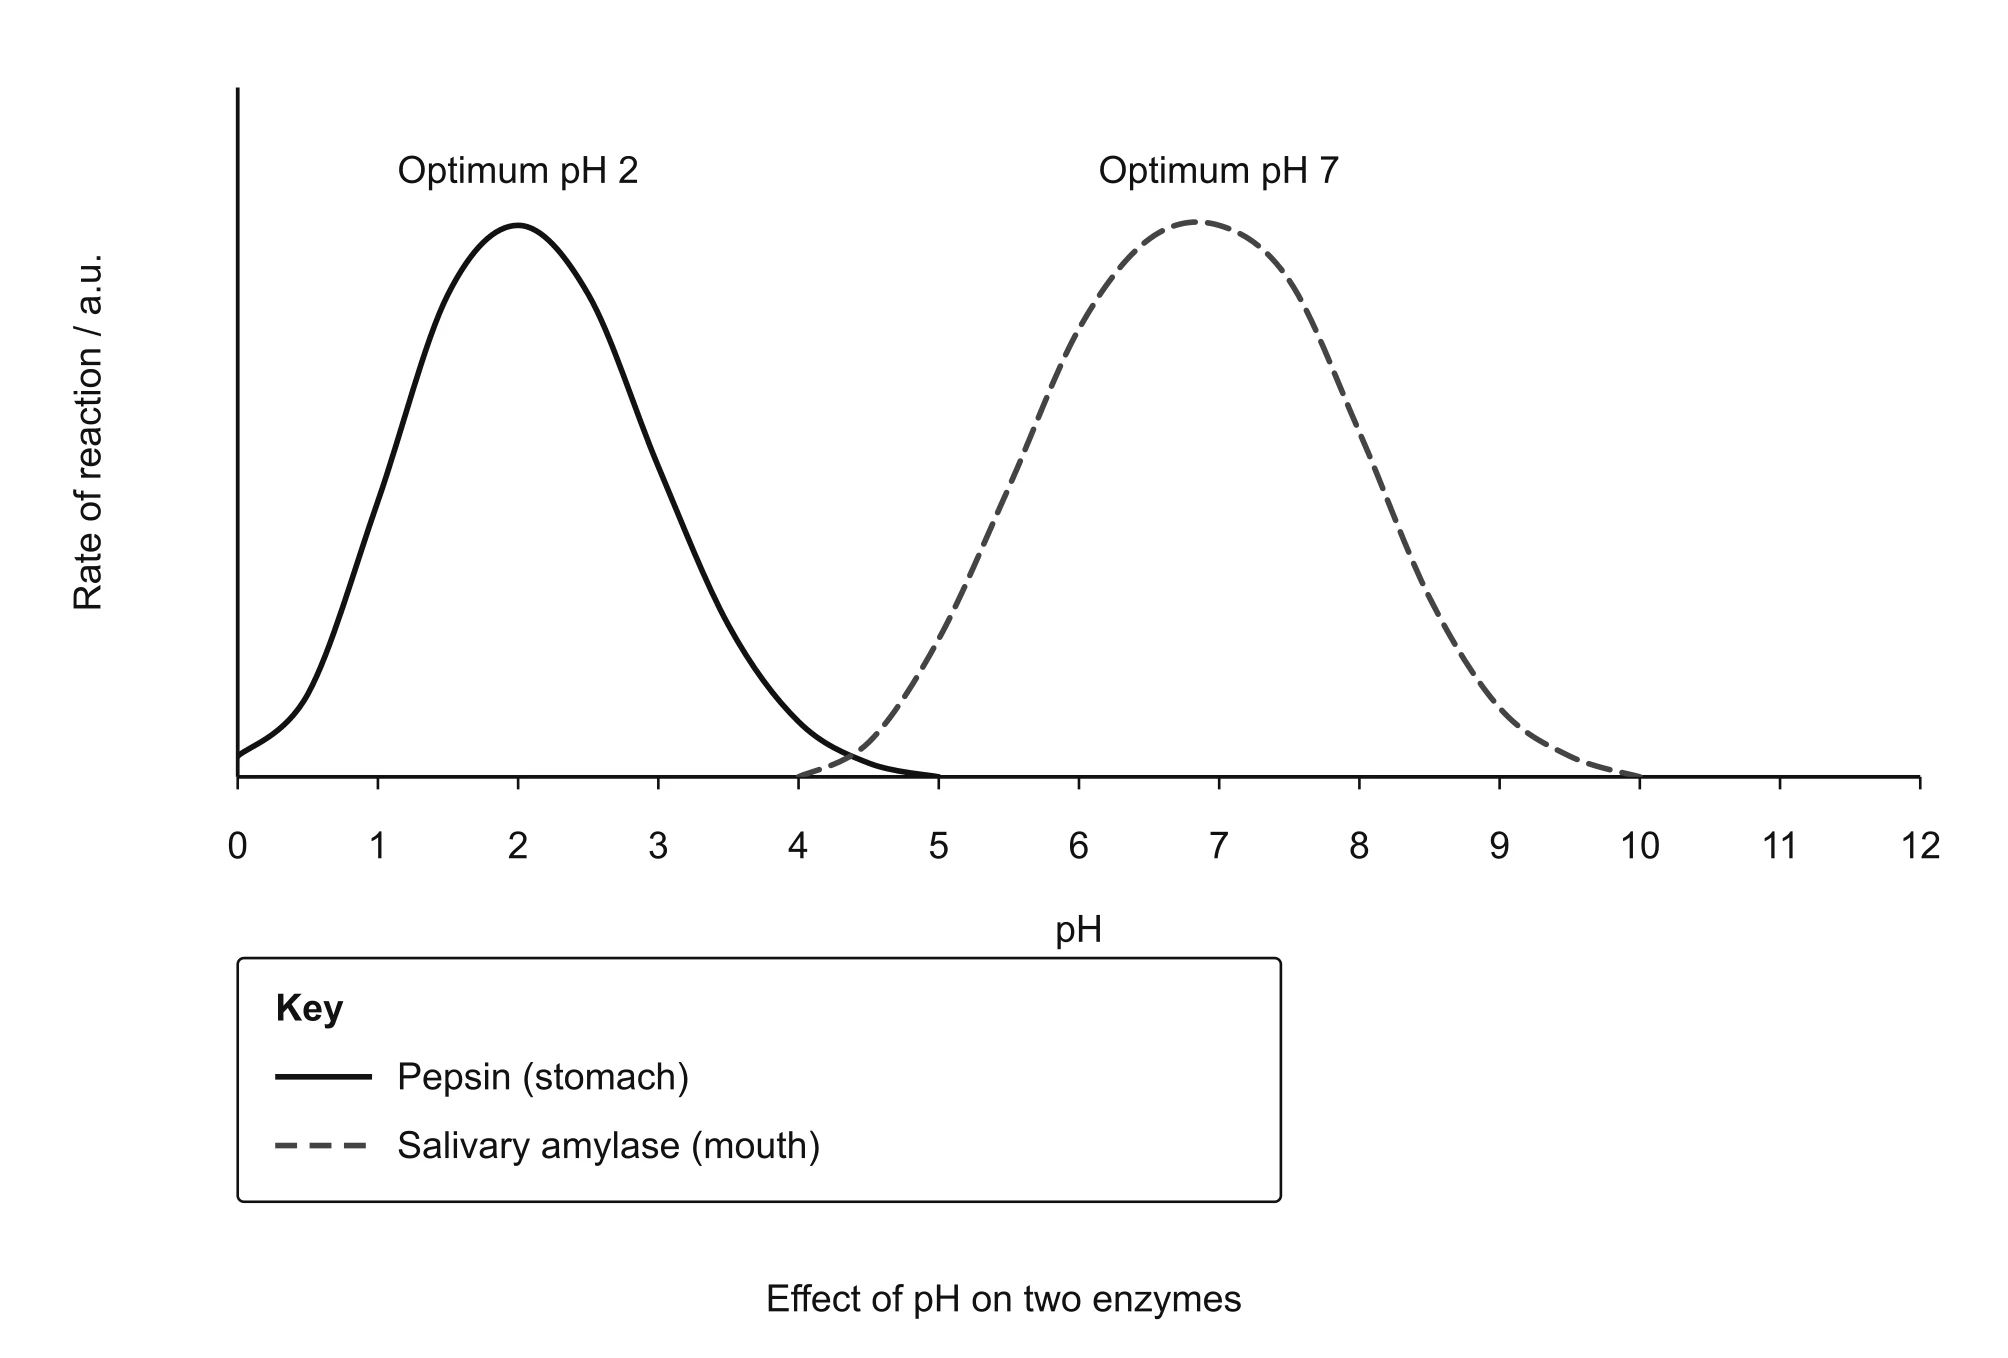
The graph below compares two . Notice that each one has its own curve, and read the notes underneath.
 Open full size
 - The x axis shows from 0 to 12. The y axis shows in arbitrary units.
- The solid curve is pepsin. Its peak is at 2, so this is its .
- The dashed curve is . Its peak is at 7.
- Each curve falls on both sides of its . Moving the in either direction changes the charges on the and reduces the number of .
- Each only works over a narrow range of about 3 or 4 units. At 4.5 both have very low activity.
- This explains a real piece of biology. When food and saliva are swallowed into the acidic stomach, stops working, while pepsin starts digesting protein.
A is a solution that resists changes in when small amounts of acid or alkali are added. In other words, it keeps the constant. matter in two places. In the body, fluids such as blood are buffered so that keep working. In the laboratory, a at a chosen is added to an experiment so that stays the same in every test and cannot affect the results.
Why would the change during an experiment anyway? Some reactions produce acidic . For example, when lipase breaks down fats, fatty acids are made and they lower the . Without a , the would drift during the experiment and change the for a reason that has nothing to do with the variable being tested.
How does substrate concentration affect rate?
Imagine a fixed amount of , so there is a fixed number of . Now think about what happens as you add more and more .
At low concentrations, many are empty at any moment. Adding more molecules means more collisions with , so more form each second and the increases. Here, the concentration is the . A is the factor that is in shortest supply and so holds back the .
At high concentrations, almost every is occupied at any moment. We say the are saturated. Adding even more cannot make the reaction any faster, because there are no free for the extra to bind to. The stays constant at its maximum. Now the concentration, meaning the number of , is the .
A car wash with four washing bays is a helpful example. If only one car turns up every ten minutes, the number of cars washed per hour depends on how many cars arrive. Once cars are arriving faster than the bays can handle, all four bays are busy all the time. Extra cars simply queue, and the number of cars washed per hour stops rising. The bays are the and the cars are the .
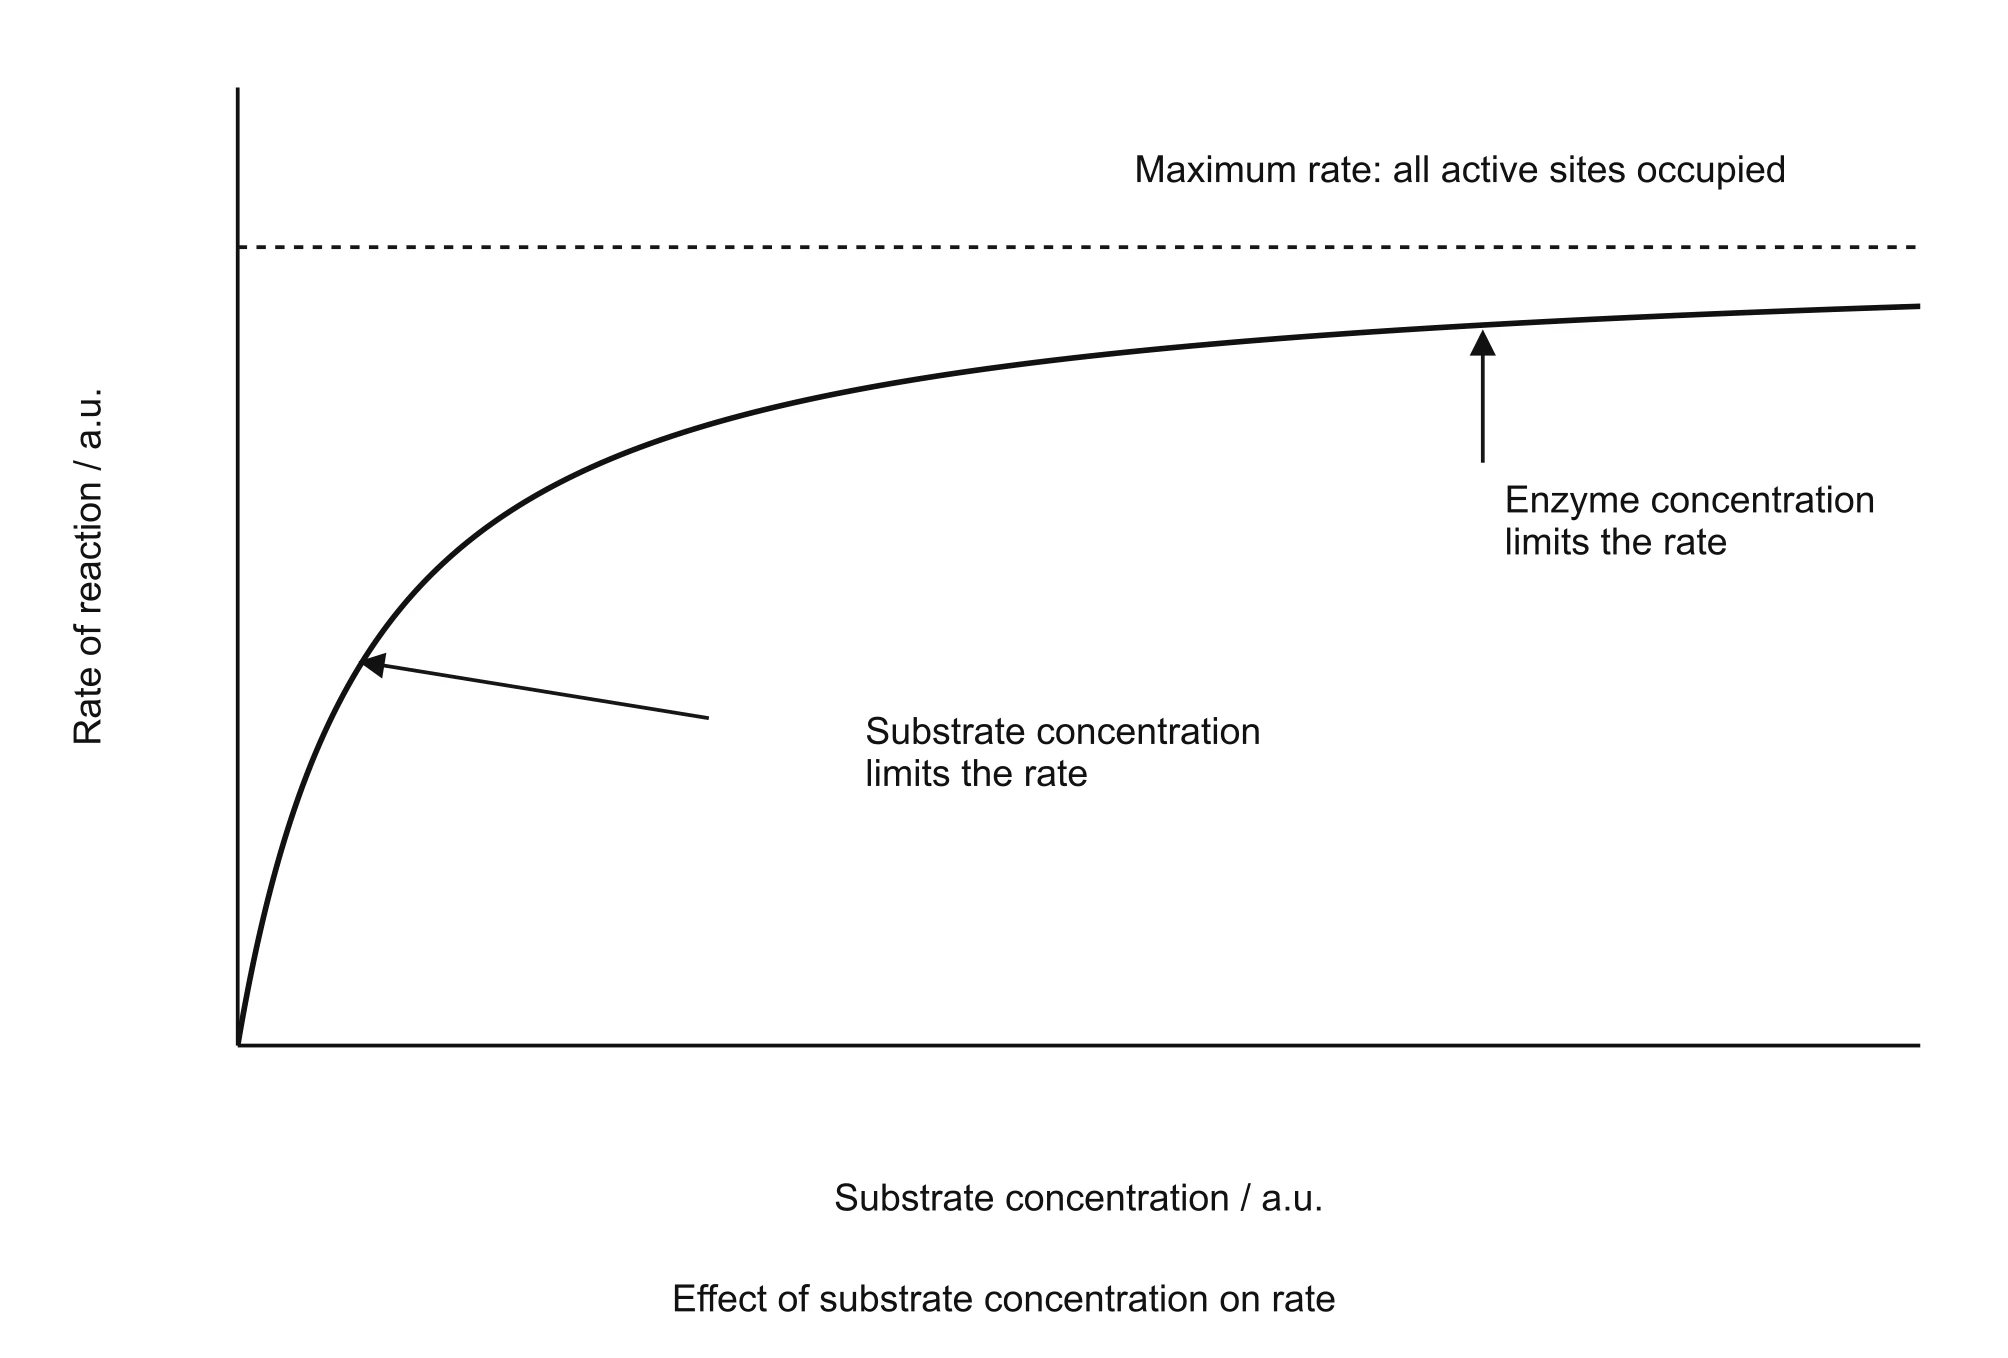
The graph below shows this relationship. It is one of the most frequently examined graphs in this topic.
 Open full size
 - The x axis shows concentration and the y axis shows . The concentration is the same all the way along the curve.
- At low concentrations the curve rises steeply. increases as concentration increases because is the .
- As the concentration keeps increasing, the curve bends and becomes less steep, because more and more are already occupied.
- At high concentrations the curve levels off. The is constant and close to the shown by the dashed line.
- On the flat part, concentration is the because all the are occupied.
- The curve levels off, but it does not drop. The reaction has not stopped, it is running at its .
How does enzyme concentration affect rate?
Now do the opposite. Keep the concentration high and increase the amount of . If there is plenty of , which we call in excess, every extra molecule provides extra that will quickly be filled. More means more per second, so the increases in direct proportion to the concentration. Doubling the doubles the , and the graph is a straight line.
If the amount of is limited, something different happens at high concentrations. There are now more than there are molecules to fill them. Adding more just adds more empty , so the levels off. The concentration has become the .
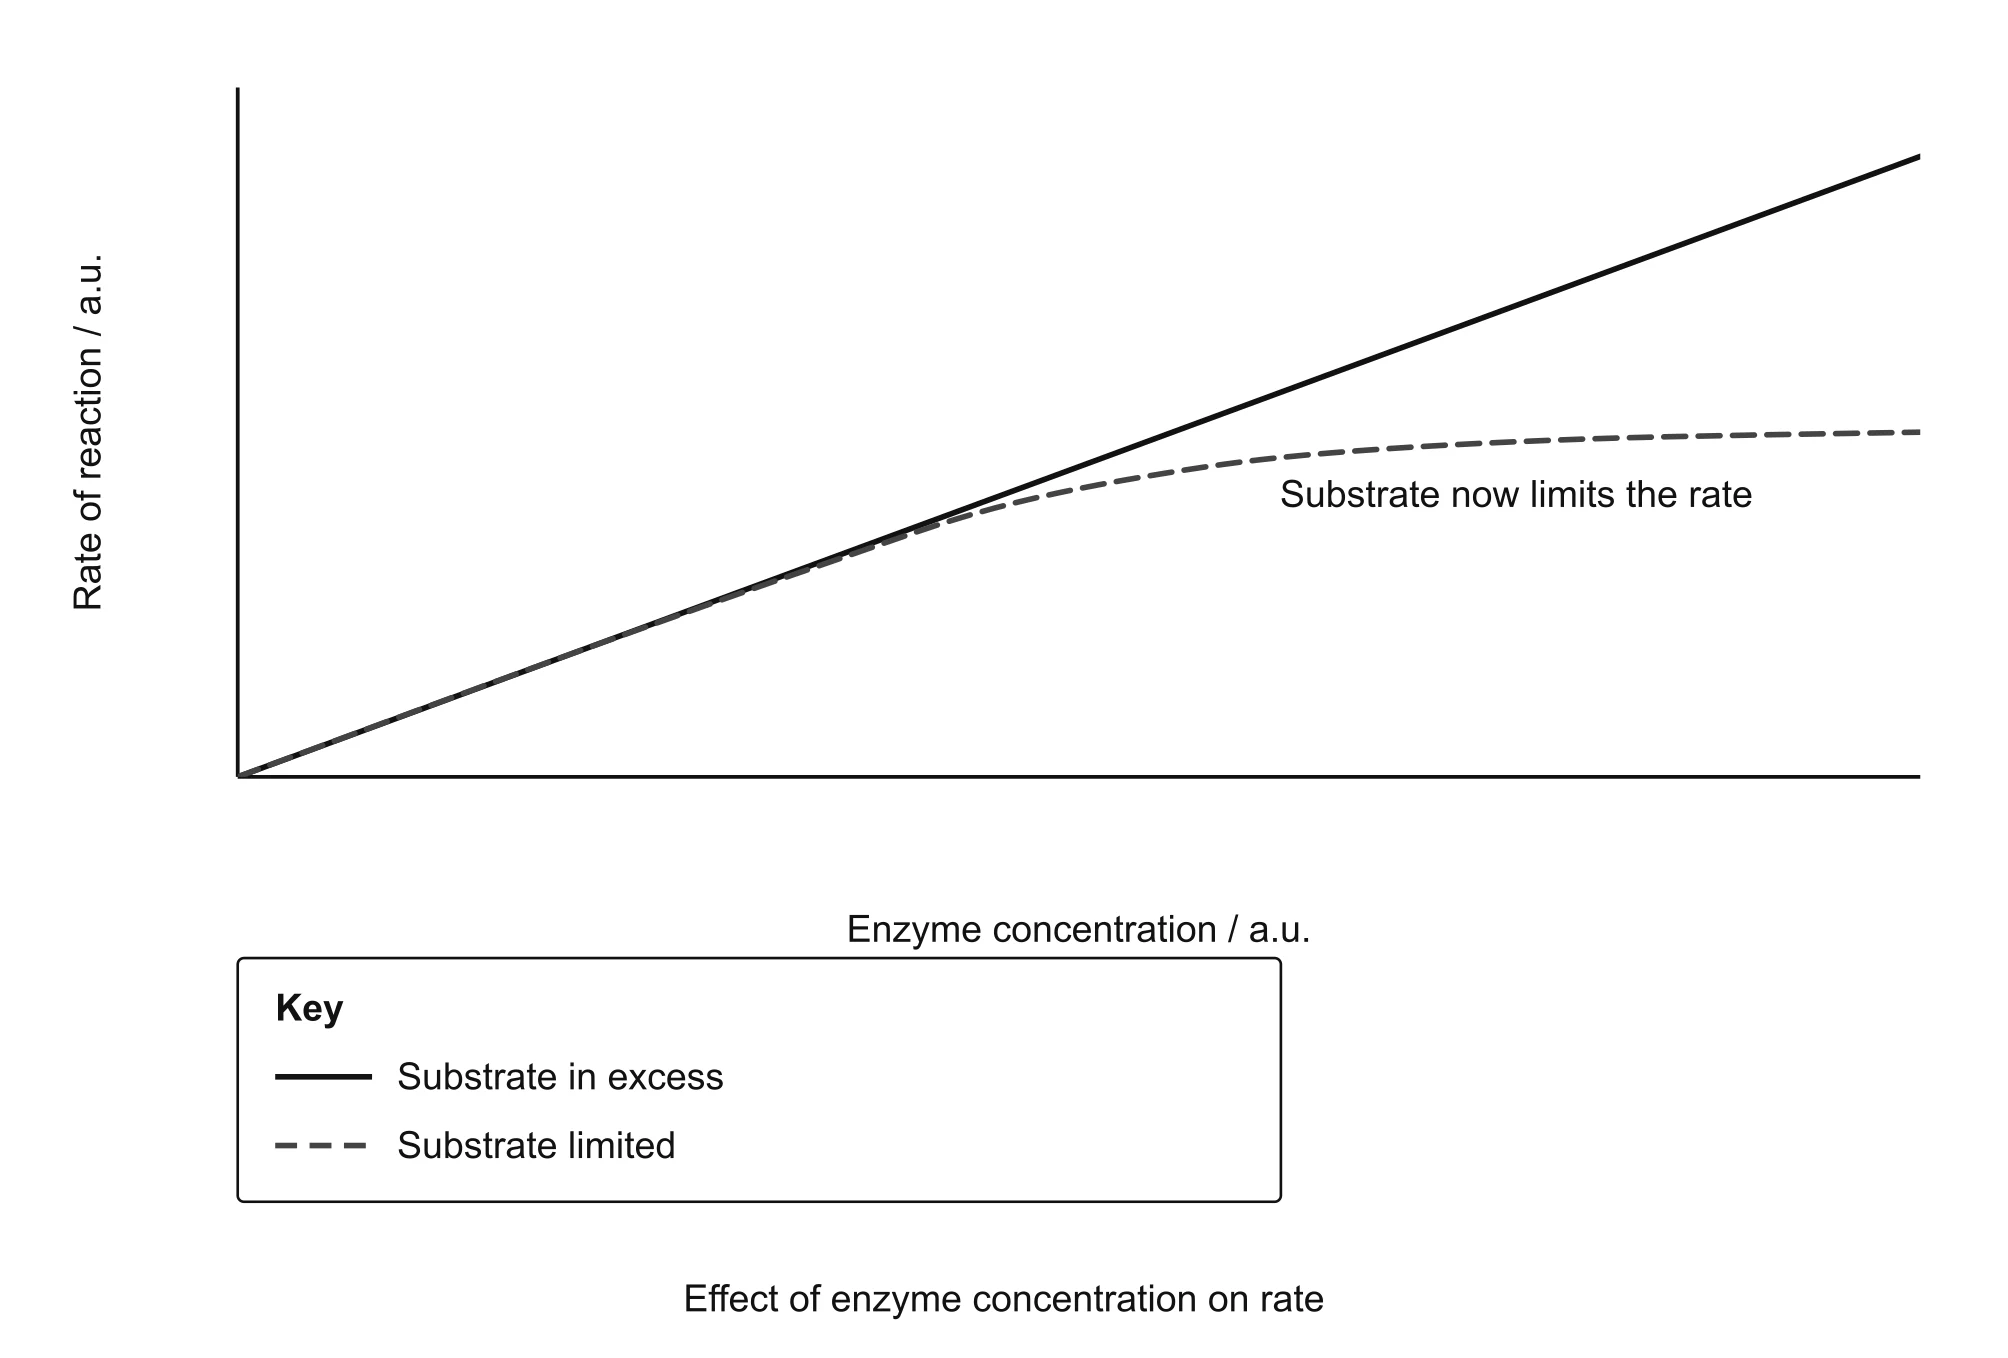
The graph below shows both situations on one set of axes.
 Open full size
 - The x axis shows concentration and the y axis shows .
- The solid straight line shows what happens when is in excess. The increases in direct proportion to concentration all the way along.
- The dashed curve shows what happens when the amount of is limited. At first it follows the straight line exactly, because there is still enough to fill the .
- Around the middle of the graph the dashed curve bends away from the straight line and levels off.
- On the flat part of the dashed curve, concentration is the . Adding more does not increase the .
Scroll sideways to view all columns.
| Feature | Increasing substrate concentration | Increasing enzyme concentration |
|---|---|---|
| What is kept constant | concentration | concentration |
| Shape of the graph | Rises, then levels off | Straight line if is in excess, levels off if is limited |
| on the rising part | concentration | concentration |
| on the flat part | concentration, because all are occupied | concentration, because there is not enough to fill the extra |
What are competitive and non-competitive inhibitors?
An is a molecule that reduces the of an controlled reaction. It does this by reducing the number of that can form. The specification asks you to understand the principles of two types: competitive and .
A has a shape similar to the . This means it is also to the , so it can bind to the . While it is there, the cannot bind. The and the are competing for the same , which is where the name comes from.
How a works
- 1. The has a similar shape to the
- 2. It is to the and binds there
- 3. The cannot enter an occupied
- 4. Fewer form
- 5. The falls
Because it is a competition, the effect depends on how much of each molecule is present. If you add more , a molecule is more likely than an molecule to collide with any free . At very high concentrations the has very little effect, and the gets close to the same as the reaction without an .
A real medical example appeared in a WJEC paper. Ethylene glycol, found in antifreeze, is poisonous because the alcohol dehydrogenase converts it into a toxic . Doctors treat the poisoning by giving the patient ethanol. Ethanol has a similar shape to ethylene glycol and competes for the of alcohol dehydrogenase, so less of the toxic is made.
A does not bind to the . It binds to a different site on the , sometimes called an . When it binds, it changes the of the , which changes the shape of the . The is no longer to the , so cannot form.
How a works
- 1. The binds to a site other than the
- 2. The of the changes
- 3. The shape of the changes
- 4. The is no longer and cannot bind
- 5. Fewer form and the falls
Adding more does not help, because the is not competing for the . Every molecule with an attached is out of action no matter how much is present. So the is lower. Copper ions from copper sulfate act as a of , which WJEC has used in both written and practical papers.
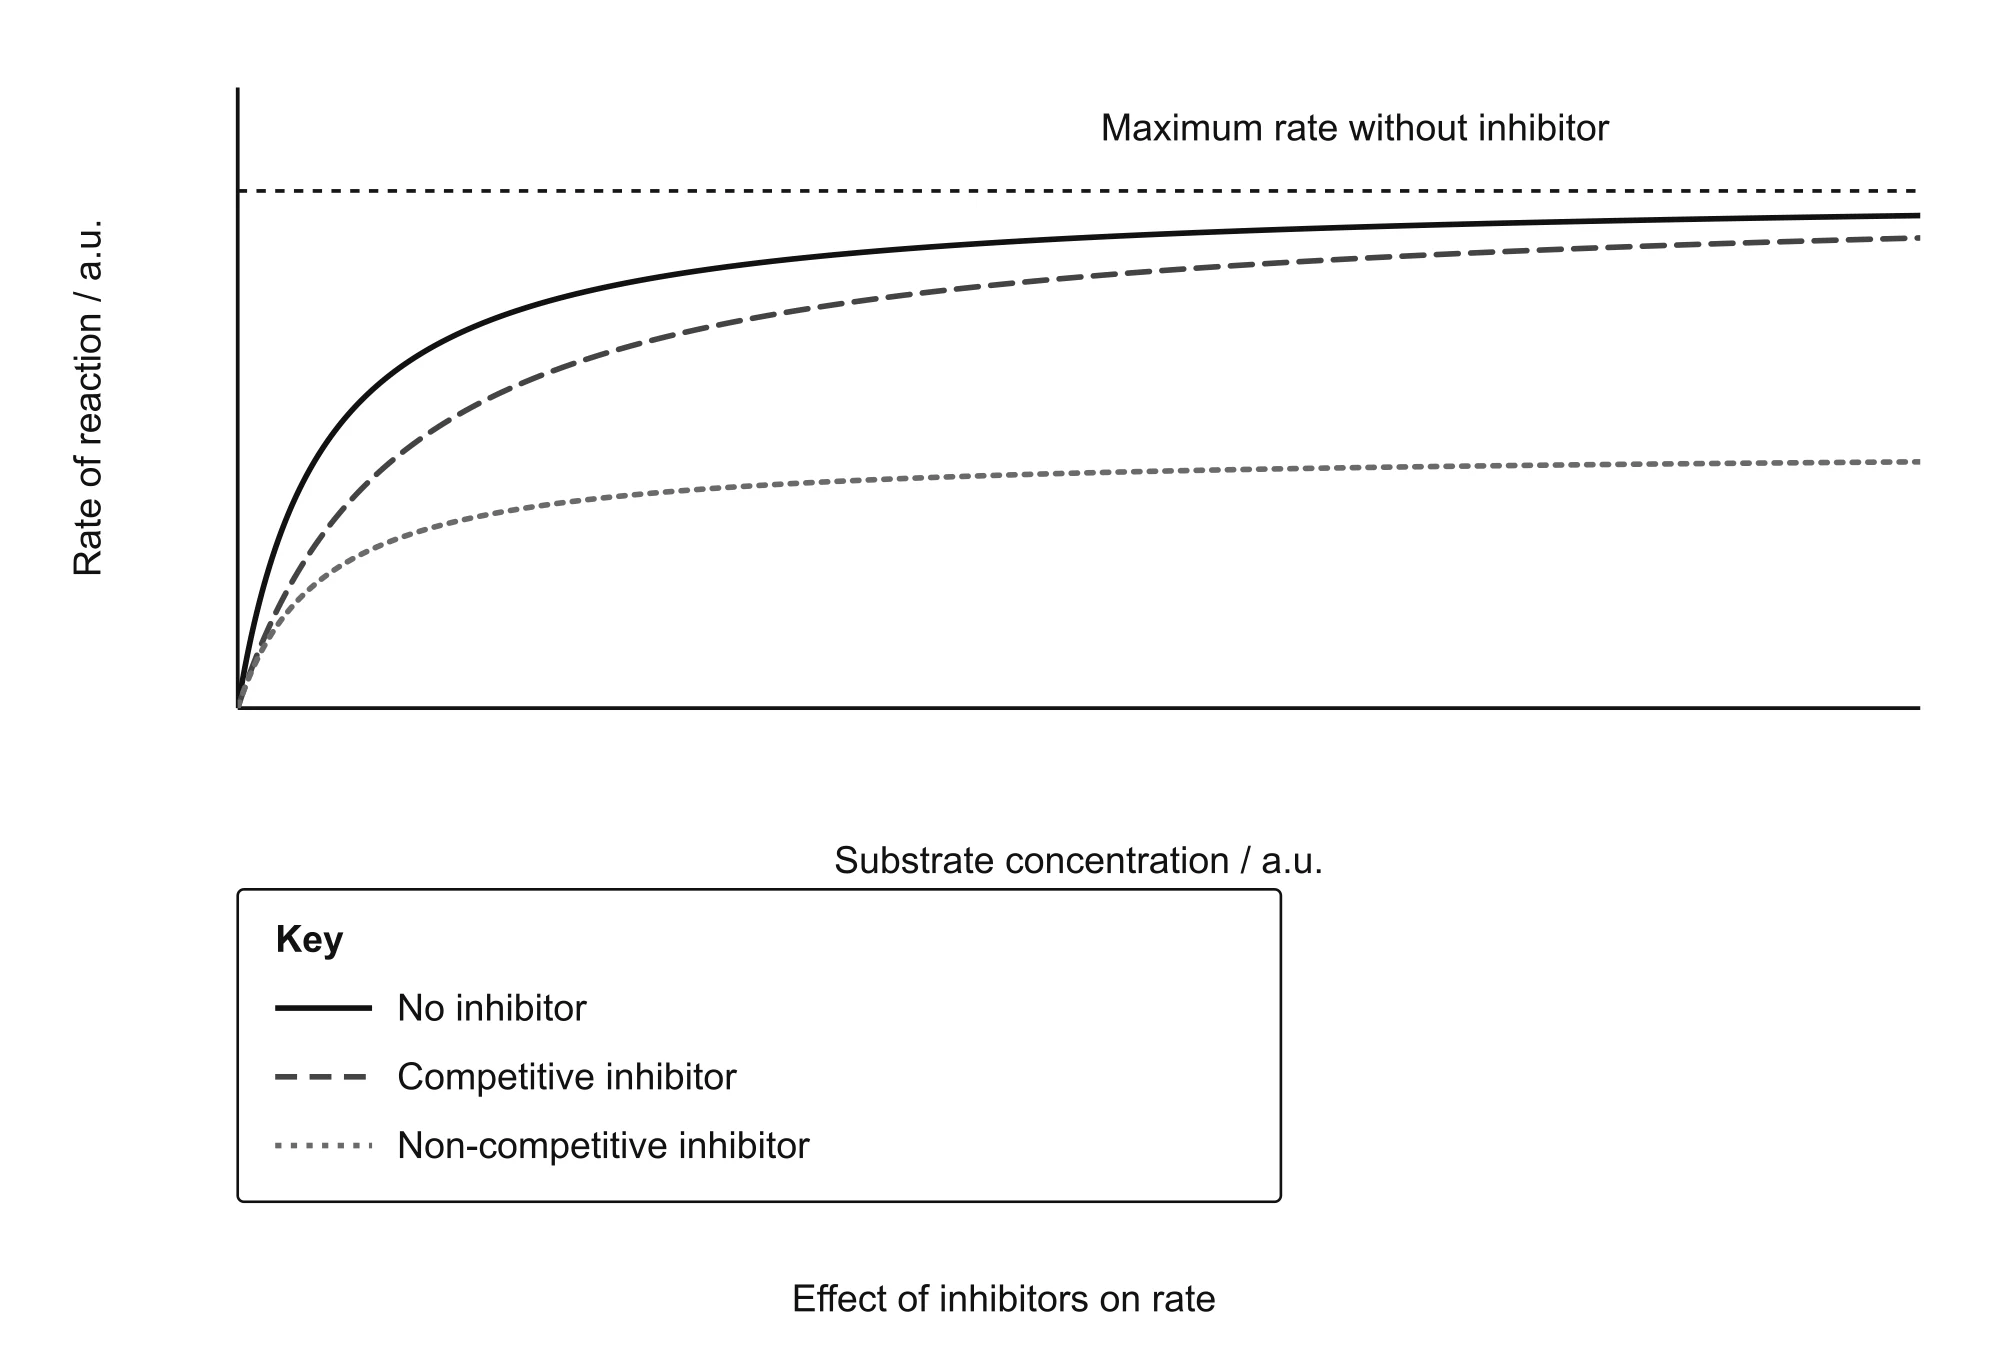
The graph below shows how each type of affects the concentration graph you met earlier.
 Open full size
 - The solid curve is the reaction without an . It rises and levels off close to the shown by the dashed horizontal line.
- The dashed curve is the reaction with a . At low concentrations it is well below the solid curve, because the is winning much of the competition for .
- As concentration increases, the dashed curve keeps rising and gets closer and closer to the solid curve. With enough , it approaches the same .
- The dotted curve is the reaction with a . It levels off much earlier and at a much lower .
- However much is added, the dotted curve never reaches the , because some have permanently misshapen while the is attached.
Scroll sideways to view all columns.
| Feature | Competitive inhibitor | Non-competitive inhibitor |
|---|---|---|
| Where it binds | The | A site other than the |
| Shape compared with the | Similar to the , so to the | Not similar to the |
| Effect on the | Blocks it | Changes its shape by changing the |
| Effect of adding more | Reduces the | Does not reduce the |
| Can still be reached at high concentration | Lower than without the | |
| Example | Ethanol with alcohol dehydrogenase | Copper ions with |
What are immobilised enzymes and why does industry use them?
Scientists' understanding of structure has allowed to be used widely in industry. For example, lactase is used to make lactose-free milk for people who are lactose intolerant, and glucose oxidase is used in that measure the concentration of glucose.
The simplest way to use an is to mix it into a solution of its . This causes problems. The ends up mixed with the , so it has to be separated out or it contaminates the . The is also lost at the end of each batch, so new has to be bought every time.
An is an that is fixed in place, so it cannot mix freely with the . A common method is to trap the inside small beads of a jelly-like substance called . The beads are packed into a column and the solution is poured through. The diffuses into the beads, the catalyses the reaction, and the diffuse out and flow away. The stays behind in the column.
Making lactose-free milk with lactase
- 1. Milk containing lactose is poured into the top of a column of
- 2. Lactose diffuses into the beads
- 3. lactase lactose into glucose and galactose
- 4. Glucose and galactose diffuse out of the beads
- 5. Lactose-free milk flows out of the bottom of the column
- 6. The lactase stays in the beads and can be used again
- Trapping the inside a gel, such as
- Attaching the to the surface of an insoluble material
- Enclosing the behind a
Scroll sideways to view all columns.
| Advantage | Explanation |
|---|---|
| The can be reused | It stays in the column instead of leaving with the , so the same is used many times and costs are lower |
| The is not contaminated with | No extra step is needed to separate the from the |
| The is more stable | The surrounding material helps hold the in shape, so it is less easily and works over a wider range of temperature and |
| The process can run continuously | can be passed through the column all the time instead of in separate batches |
A WJEC question compared free lactase with lactase in at different temperatures. Below 50 °C, the free lactase was more active. The free and can move around and collide easily, while the has to diffuse into the beads to reach the . Above 50 °C, the lactase was more active. The free lactase was being , but stabilised the and helped the keep its shape.
use the same idea. A glucose contains glucose oxidase. The of glucose oxidase is to glucose, so the sensor responds only to glucose even in a sample such as urine that contains many other substances. The reaction makes hydrogen peroxide, and the electrode turns the amount of hydrogen peroxide into an electrical signal that is shown as a reading.
Specified practical work: enzyme investigations
The specification lists two investigations that you must carry out. The first investigates the effect of temperature or on activity. The second investigates the effect of or concentration. The walkthroughs below cover every version, so you are prepared whichever one your school chose and whichever one appears in the exam.
These investigations also build the skills WJEC tests again and again: choosing and controlling variables, using a and , making , recording results in a table, calculating means and rates, plotting graphs with and evaluating a method.
Scroll sideways to view all columns.
| Term | Meaning | Example from these investigations |
|---|---|---|
| The factor you deliberately change | Temperature of the | |
| The factor you measure | Time taken for starch to disappear | |
| A factor you keep the same so it cannot affect the results | , kept constant with a | |
| An extra test without the factor thought to cause the effect, to show that it is responsible | Boiled and cooled , which should give no reaction | |
| How close repeat readings taken with the same method are to each other | Short show readings that are | |
| The smallest change an instrument can show | A stopwatch reading to 1 s, or sampling every 30 s |
Investigating the effect of temperature or pH on enzyme activity
Unit 1, section 4, specified practical 1 (BioWelsh entry number) ↗To investigate how temperature affects the activity of the , by timing how long it takes to break down starch at different temperatures. The same method is then adapted to investigate how affects activity, which is the other option allowed by the specification.
Equipment
- 1% starch solution (5 cm³ for each test): The . starch into maltose.
- 1% solution (2 cm³ for each test): The being investigated. All tests use the same stock solution so the concentration is the same.
- 7 (2 cm³ for each test): Keeps the constant in every test, so cannot affect the .
- Iodine solution in a dropping bottle: Turns blue-black when starch is present and stays orange-brown when all the starch has gone.
- White spotting tile: Holds separate drops of iodine so that samples can be tested one after another. The white background makes the colour easy to see.
- Thermostatically controlled (Set to 20, 30, 40, 50 and 60 °C): Keep each test at a constant, known temperature.
- Thermometer (Reading to 1 °C): Checks that the solutions really are at the intended temperature.
- Graduated pipettes or syringes, a separate one for each solution (5 cm³ and 2 cm³): Measure volumes accurately. Using a separate one for each solution avoids mixing into the stock starch.
- Test tubes and a test tube rack (Two for each test): Hold the starch and solutions while they reach the right temperature.
- Dropping pipette or glass rod, and a beaker of distilled water: Transfers a drop of the reaction mixture to the iodine. Rinsing it in distilled water between samples stops starch being carried from one drop to the next.
- Stopwatch: Times the reaction from the moment the solutions are mixed.
- Eye protection: Protects the eyes from splashes of iodine solution.
- For the version: solutions and a meter ( of 4, 5, 6, 7, 8 and 9): A different sets each , and the meter checks it.
Model answer: describe the method
Describe how you would carry out an investigation into the effect of temperature on the activity of amylase. Your answer should explain how you would make sure the results are valid and repeatable.
Original practice response · 6 indicative marks
- Set up thermostatically controlled at five different temperatures, for example 20, 30, 40, 50 and 60 °C, and check each one with a thermometer.
- Using a graduated pipette, put 5 cm³ of 1% starch solution and 2 cm³ of 7 into one test tube, and using a separate graduated pipette put 2 cm³ of 1% solution into another test tube.
- Place both tubes in the for 5 minutes so that the solutions to the test temperature before they are mixed.
- Mix the with the starch, keep the tube in the and start a stopwatch immediately.
- Every 30 seconds, place one drop of the mixture onto a drop of iodine solution on a spotting tile. Record the time taken until the iodine no longer turns blue-black, which shows that all the starch has been broken down.
- Keep the constant with the same , and use the same volumes and concentrations of starch and from the same stock solutions in every test.
- Repeat the test three times at each temperature, calculate a time, and calculate the as 1 ÷ time.
- Set up a at each temperature using boiled and cooled , which should not break down the starch, to show that the change is caused by active .
What the answer needs to cover
- A suitable range of at least five temperatures, set using thermostatically controlled
- and separately at the test temperature before mixing
- A valid way of measuring the , such as the time until iodine no longer turns blue-black, sampled at regular intervals
- kept constant using a
- Volume and concentration of starch and kept the same
- At least three repeats at each temperature and a calculated
- calculated as 1 ÷ time
- A using boiled and cooled
Method, step by step
- Put one drop of iodine solution into each well of the spotting tile. Why: The tile is ready before the reaction starts, so samples can be tested quickly at exact times.
- Use a graduated pipette to put 5 cm³ of 1% starch solution and 2 cm³ of 7 into a test tube. Why: Measuring accurately keeps the amount of the same in every test, and the keeps the constant.
- Use a different graduated pipette to put 2 cm³ of 1% solution into a second test tube. Why: Keeping the separate means the reaction cannot start before the solutions reach the test temperature.
- Stand both tubes in the 20 °C for 5 minutes. Check the temperature with a thermometer. Why: This lets both solutions , meaning they reach the test temperature before mixing. Otherwise the reaction would begin at room temperature, not at the temperature being tested.
- Pour the into the starch tube, mix, keep the tube in the and start the stopwatch straight away. Why: Timing must start at the moment and meet, and the mixture must stay at the test temperature.
- Straight away, and then every 30 seconds, use the rinsed pipette or glass rod to put one drop of the mixture onto a fresh drop of iodine. Note the colour each time. Why: A blue-black colour shows that starch is still present. Sampling at regular, fixed intervals makes the timing fair.
- Rinse the pipette or glass rod in distilled water after every sample. Why: This stops starch or iodine being carried into the next well, which could give a false result.
- Record the time of the first sample that does not turn blue-black. This is the . If there is no after 15 minutes, record more than 900 s. Why: The shows when all the starch has been broken down. A time limit stops a test running forever at temperatures where the is .
- Repeat steps 1 to 8 two more times at 20 °C, using fresh solutions, then calculate the time. Why: Three repeats let you spot anomalous readings, judge and calculate a more reliable .
- Repeat the whole procedure at 30, 40, 50 and 60 °C. Why: Five temperatures, evenly spaced, show the pattern clearly on both sides of the .
- As a , repeat the test at each temperature using that has been boiled for 10 minutes and then cooled. Why: Boiling the . If the iodine stays blue-black, this shows that active , not temperature alone, breaks down the starch.
- Calculate the for each temperature using = 1 ÷ time. Why: A shorter time means a faster reaction. Using 1 ÷ time gives a value that is larger when the reaction is faster.
Variables
- : Temperature. Five temperatures, 20, 30, 40, 50 and 60 °C, set using thermostatically controlled and checked with a thermometer. This is the factor being tested, so it is the only thing deliberately changed between tests. Example: At 20 °C the reaction took a of 480 s, while at 40 °C it took 170 s.
- : Time taken for the starch to disappear, used to calculate . Measured by sampling the mixture onto iodine every 30 seconds until it no longer turns blue-black. is calculated as 1 ÷ time. This is how the effect of temperature on activity is measured.
- : . Kept at 7 by adding 2 cm³ of the same 7 to every test. changes the charges on in the . If varied, the could change for a reason other than temperature.
- : Concentration and volume of starch. 5 cm³ of 1% starch from the same stock solution, measured with a graduated pipette. More would take longer to break down, which would change the time even at the same temperature.
- : Concentration and volume of . 2 cm³ of 1% from the same stock solution, measured with a separate graduated pipette. More means more and a faster reaction, so the amount must be the same in every test.
- : time. Both solutions stand in the for 5 minutes before mixing. If one test started warmer or cooler than another, the early part of the reaction would run at the wrong temperature.
- : Sampling interval and drop size. A sample is taken every 30 seconds, using the same pipette or glass rod so each drop is similar in size. Taking samples at different intervals would change how precisely the is found.
- comparison: Boiled and cooled . Set up at each temperature in exactly the same way, but with that has been boiled and then cooled. This is not a . It is a separate test showing that the starch is broken down by active . The iodine should stay blue-black throughout.
Understanding the variables in this investigation
The is the one thing you choose to change. Here it is temperature. You change it by moving the tubes to a different , and you check it with a thermometer, because a dial is not always .
The is what you measure to see the effect. Here you measure the time taken for the starch to disappear. You then turn it into a by calculating 1 ÷ time, because is what the biology is about.
are everything else that could change the , kept the same so the comparison is fair. For , the main ones are , the concentration and volume of starch, and the concentration and volume of . Each one matters for a biological reason. affects the charges in the , the amount of changes how long it takes to break it all down, and the amount of changes how many there are.
The is different from a . It is an extra test using boiled and cooled . Because boiling the , the starch should not disappear. This proves that the starch in the real tests was broken down by active and not simply by the heat of the .
Why iodine shows the end point
- Iodine solution is orange-brown.
- When it meets starch, it turns blue-black.
- As starch into maltose, there is less and less starch in the mixture.
- When all the starch has gone, a drop of the mixture no longer changes the colour of the iodine.
- The time when this first happens is the , and the faster the reaction, the sooner it arrives.
Changing the method to investigate pH
- Keep every tube in one at a single constant temperature, for example 35 °C. Temperature is now a .
- Replace the 7 with of different values, for example 4, 5, 6, 7, 8 and 9. is now the .
- Use the same volume of in every tube, and check the of each with a meter.
- Keep the volumes and concentrations of starch and the same as before.
- Time the in the same way, repeat three times at each and calculate the .
- Expect the to be highest at the , around 7 for , and to fall on both sides.
Temperature version or pH version: what is different?
- In the temperature version the is set with , while in the version it is set with solutions.
- In the temperature version a single keeps constant, while in the version a single keeps temperature constant. The two factors swap roles.
- The temperature graph usually rises gradually and then falls steeply, because is rapid and permanent. The graph usually falls on both sides of the .
- The explanations are different. Temperature is explained using and collisions, then . is explained using changing charges on , then at extreme .
Other methods you might meet in an exam
- A can measure the of a starch and iodine mixture. As starch is digested, falls. This removes the subjective judgement of colour.
- Trypsin can be used with a cloudy suspension of milk powder. The time taken for the suspension to become clear is measured, because trypsin digests the milk protein. WJEC used this method in 2019.
- can be used with hydrogen peroxide at different temperatures, measuring oxygen released or using the filter paper disc method from the second practical.
- Whatever the , the same principles apply: one , a clear way to measure , , repeats, a and a .
Results and analysis
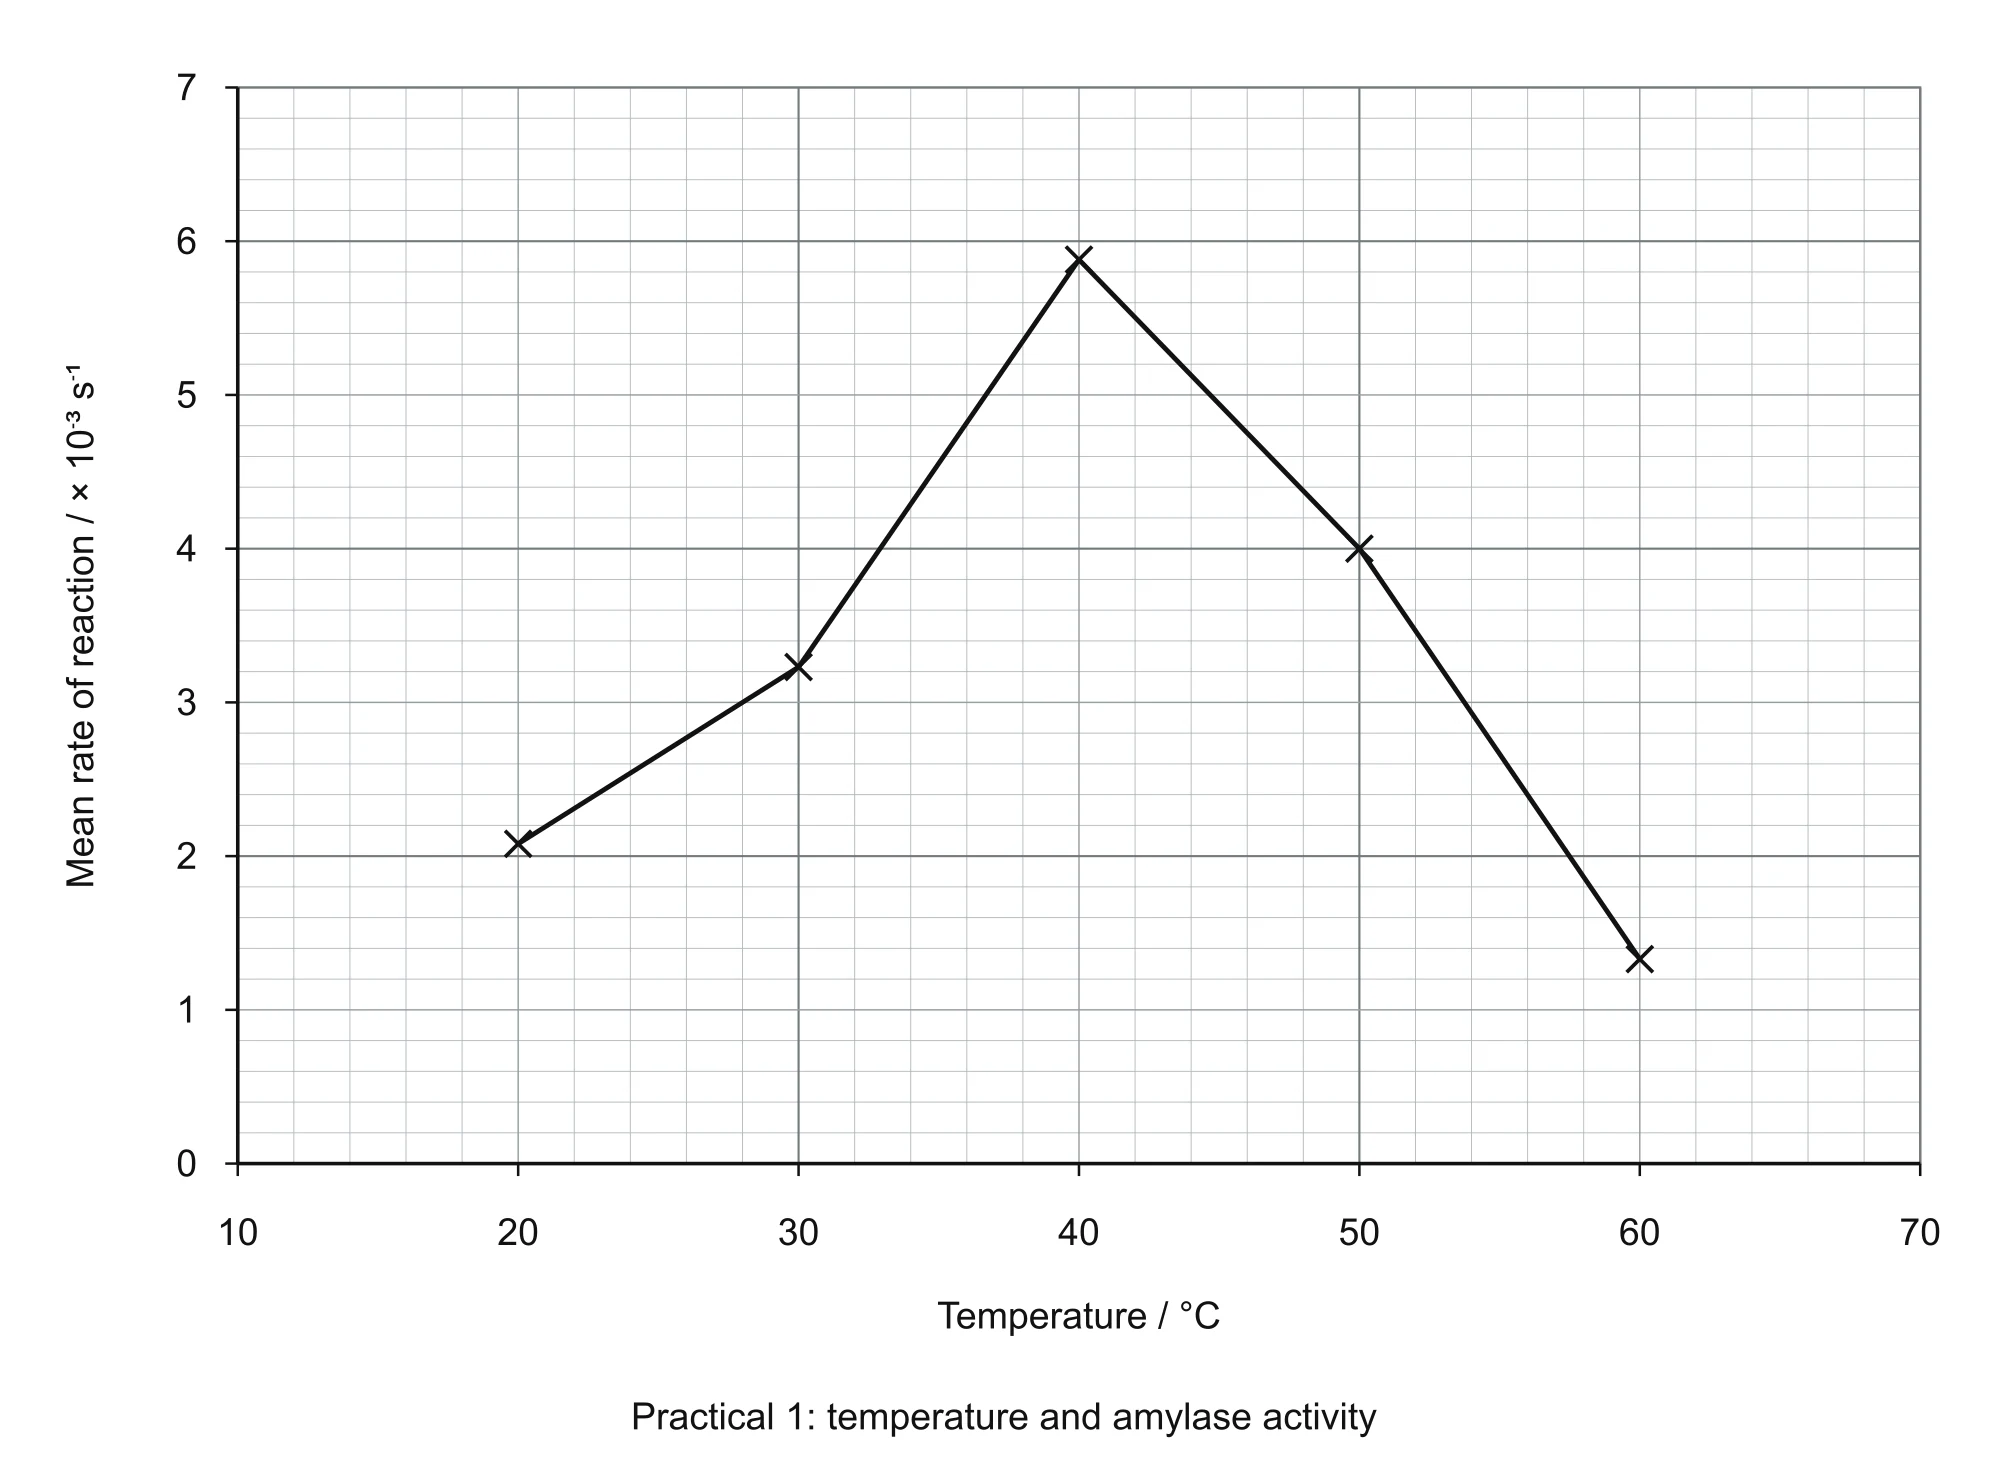
Any example results below are illustrative. Plot on the y axis against temperature on the x axis, with points joined by straight ruled lines. The increases from 2.08 × 10⁻³ s⁻¹ at 20 °C to a maximum of 5.88 × 10⁻³ s⁻¹ at 40 °C. It then falls to 4.00 × 10⁻³ s⁻¹ at 50 °C and to 1.33 × 10⁻³ s⁻¹ at 60 °C. Between 20 °C and 40 °C, the rise in temperature gives and molecules more , so there are more and more form each second. Above 40 °C, hydrogen and ionic bonds in the break, the changes shape and fewer form because the is being . The is close to 40 °C, but because readings were only taken every 10 °C, the true could be anywhere between about 30 °C and 50 °C. The repeat readings at each temperature are within 60 s of each other, so the results are reasonably . In the tubes with boiled , the iodine stayed blue-black throughout, confirming that active caused the starch to disappear. time at 40 °C = (180 + 150 + 180) ÷ 3 = 170 s at 40 °C = 1 ÷ 170 = 0.00588 = 5.88 × 10⁻³ s⁻¹ at 60 °C = 1 ÷ 750 = 0.00133 = 1.33 × 10⁻³ s⁻¹ in measuring 5 cm³ of starch with a pipette to ± 0.1 cm³ = (0.1 ÷ 5) × 100 = 2%
Evaluation
Samples were only taken every 30 seconds. The is only known to the nearest 30 seconds. At 40 °C, where the time was 170 s, a 30 second gap is a large fraction of the measurement, so the is less at the temperatures where the reaction is fastest. Improvement: Take samples more often, for example every 10 seconds, or use a to measure the fall in continuously. Deciding when the blue-black colour has disappeared is a subjective judgement. Different people, or the same person on different tests, may choose a slightly different , which reduces the and of the times. Improvement: Compare each drop with a colour standard, or use a to give an objective reading. Temperatures were tested at 10 °C intervals. The cannot be identified precisely. It could lie anywhere between 30 °C and 50 °C. Improvement: Repeat the investigation at smaller intervals, for example every 2 °C between 30 °C and 50 °C. Drops of mixture and drops of iodine are not a fixed volume. A larger drop of mixture contains more starch, so it may still turn blue-black when a smaller drop would not. This makes the less consistent. Improvement: Use a graduated pipette to add a fixed volume of iodine solution and a fixed volume of reaction mixture. If simple beakers of water are used instead of thermostatically controlled , the temperature drifts. Hot water cools and cold water warms during the test, so the reaction does not stay at the intended temperature. Improvement: Use thermostatically controlled and check the temperature with a thermometer throughout.
Safety
Iodine solution: Can irritate the eyes and stains skin and clothing. : Wear eye protection, wipe up spills straight away and wash any iodine off skin with water. solution: can cause allergic reactions if they get onto skin or are breathed in as dust or spray. : Avoid skin contact, do not make splashes or sprays, wipe up spills with a damp cloth and wash hands after the practical. Hot water in the 50 °C and 60 °C : Hot water can scald hands. : Use a test tube holder to move tubes and do not put hands into the water. Boiling the for the : Boiling water and steam can cause burns. : Use tongs or a test tube holder, point the tube away from people and wear eye protection. Glass test tubes and pipettes: Broken glass can cause cuts. : Check glassware for chips before use and report breakages so they can be cleared safely.
Exam practice
Explain why the starch solution and the amylase solution were placed separately in the water bath for 5 minutes before they were mixed.
This lets both solutions , so that they are both at the test temperature before the reaction starts. If they were mixed straight away, the reaction would begin at room temperature, so the and would not have the expected at the test temperature and the time would not reflect that temperature. Both solutions reach the same, intended temperature before mixing So that the and have the for that temperature from the start of the reaction Saying it keeps the at its is not credited
Suggest how this method could be changed to investigate the effect of pH on the activity of amylase.
Repeat the investigation using solutions with a range of different values, such as 4 to 9, instead of the 7 . Keep all other factors the same, for example by keeping the temperature constant in one and using the same volume and concentration of starch and . Use to give a range of values Keep other variables the same, naming at least two, such as temperature and concentration
Suggest a suitable control for this experiment, describe the result you would expect and state the purpose of the control.
Repeat the test using that has been boiled and then cooled. The iodine would stay blue-black throughout, because the starch would not be broken down. This shows that it is active that breaks down the starch, not the temperature or any other factor. Boiled and cooled Iodine stays blue-black, meaning starch is not broken down Shows that active is responsible for the breakdown of starch
Explain why it was not possible to find the optimum temperature precisely from these results, and suggest how the method could be improved.
The temperatures were 10 °C apart, so the highest was recorded at 40 °C but the true could be anywhere between 30 °C and 50 °C. To find it more precisely, repeat the investigation with smaller temperature intervals, for example every 2 °C, between 30 °C and 50 °C. The intervals between temperatures are too large The could lie between the readings either side of the highest Use smaller intervals around the highest
Use your knowledge of enzymes to explain the results between 40 °C and 60 °C.
The falls from 5.88 × 10⁻³ s⁻¹ at 40 °C to 1.33 × 10⁻³ s⁻¹ at 60 °C. Above the , the high breaks hydrogen and ionic bonds holding the of . The shape of the changes, so it is no longer to starch. Fewer form, so the starch takes longer to break down. The is . Describes the fall in using values from the results Bonds holding the break changes shape and is no longer to the Fewer form
Scroll sideways to view all columns.
| Temperature / °C | Trial 1 time / s | Trial 2 time / s | Trial 3 time / s | Mean time / s | Mean rate / × 10⁻³ s⁻¹ |
|---|---|---|---|---|---|
| 20 | 480 | 510 | 450 | 480 | 2.08 |
| 30 | 300 | 330 | 300 | 310 | 3.23 |
| 40 | 180 | 150 | 180 | 170 | 5.88 |
| 50 | 240 | 270 | 240 | 250 | 4.00 |
| 60 | 720 | 780 | 750 | 750 | 1.33 |
 Open full size
 Scroll sideways to view all columns.
| Feature | Temperature version | pH version |
|---|---|---|
| Temperature: 20, 30, 40, 50 and 60 °C | : 4, 5, 6, 7, 8 and 9 | |
| How it is changed | Thermostatically controlled , checked with a thermometer | A different for each , checked with a meter |
| Kept constant with | One , for example 7, in every tube | One at a single temperature, for example 35 °C |
| Expected pattern | rises to an , then falls sharply as the | peaks at the and falls on both sides |
| Main biological explanation | and collisions, then | Changing charges on , then at extreme |
Scroll sideways to view all columns.
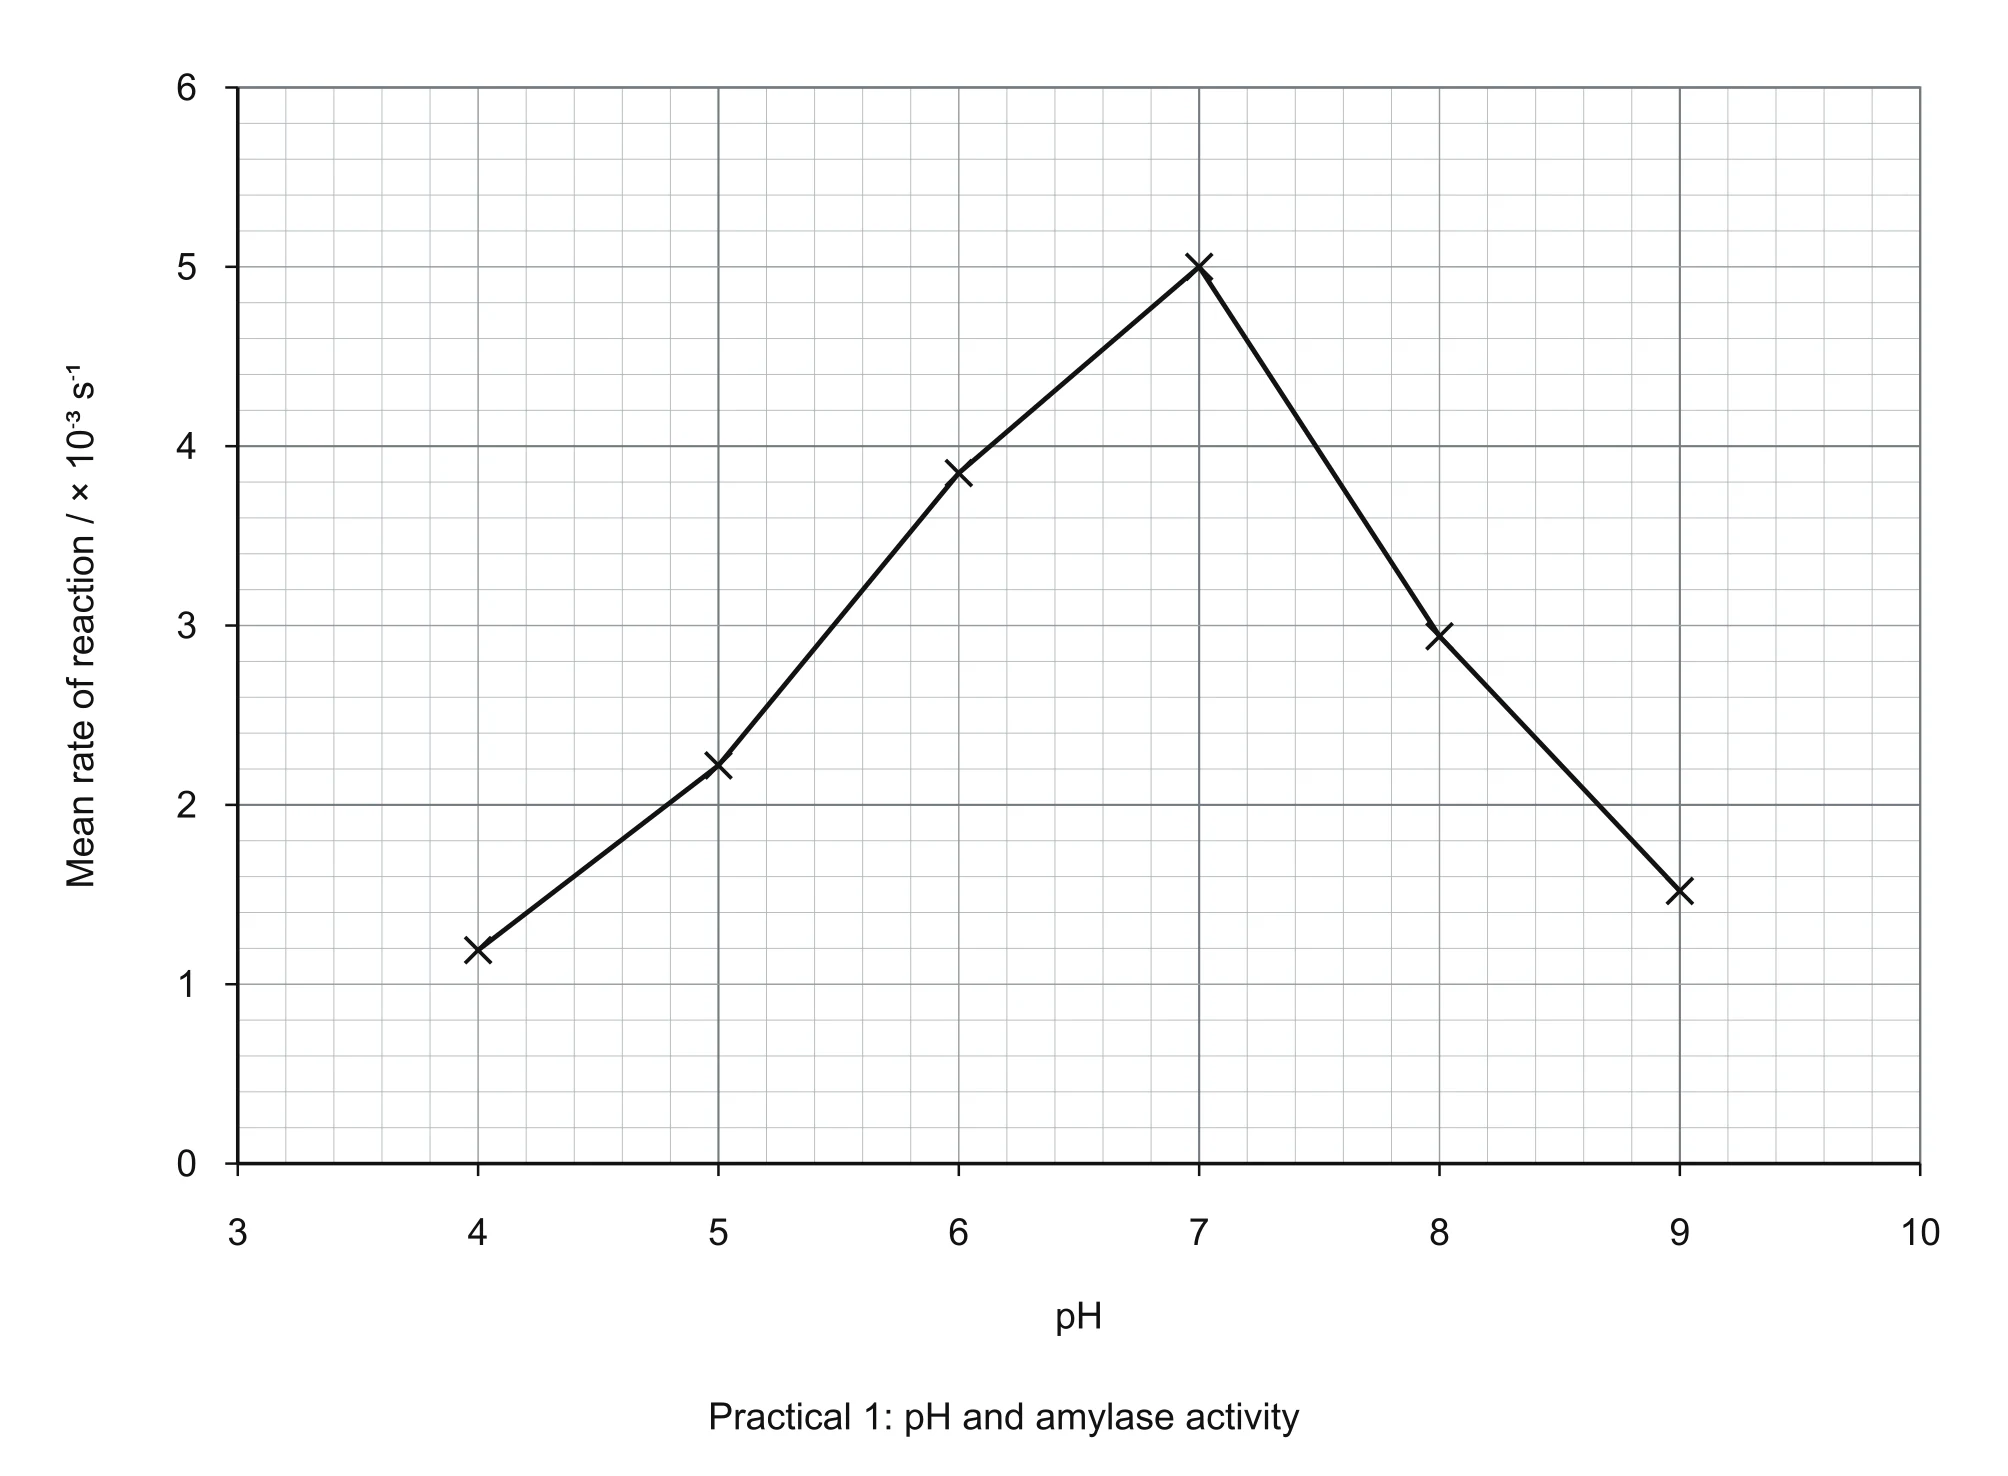
| pH | Trial 1 time / s | Trial 2 time / s | Trial 3 time / s | Mean time / s | Mean rate / × 10⁻³ s⁻¹ |
|---|---|---|---|---|---|
| 4 | 840 | 870 | 810 | 840 | 1.19 |
| 5 | 450 | 480 | 420 | 450 | 2.22 |
| 6 | 270 | 240 | 270 | 260 | 3.85 |
| 7 | 210 | 180 | 210 | 200 | 5.00 |
| 8 | 330 | 360 | 330 | 340 | 2.94 |
| 9 | 660 | 630 | 690 | 660 | 1.52 |
 Open full size
 When these results are plotted, the rises from 1.19 × 10⁻³ s⁻¹ at 4 to a peak of 5.00 × 10⁻³ s⁻¹ at 7, then falls to 1.52 × 10⁻³ s⁻¹ at 9. The lies somewhere between 6 and 8. Because readings were only taken at whole units, the exact cannot be identified. Repeating the experiment at 0.2 unit intervals between 6 and 8 would find it more precisely.
Investigating the effect of enzyme or substrate concentration on enzyme activity
Unit 1, section 4, specified practical 2 (BioWelsh entry number) ↗To investigate how the concentration of hydrogen peroxide (the ) affects the activity of , by timing how long a filter paper disc coated in potato extract takes to sink and rise. The same method is then adapted to investigate how the concentration of (the ) affects its activity, which is the other option allowed by the specification.
Equipment
- 20 vol hydrogen peroxide solution (About 150 cm³): The . breaks it down into water and oxygen. It is diluted to make the other concentrations.
- Distilled water: Used to dilute the hydrogen peroxide.
- Potato extract made in 7 (25 g of peeled potato blended with 100 cm³ of 7 , then filtered): The source of . Making it in keeps the constant.
- Filter paper discs cut with a hole punch: Carry the same small amount of into the hydrogen peroxide. A hole punch makes every disc the same size.
- Forceps: Pick up discs without touching them, so the amount of extract on each disc is not affected.
- Identical boiling tubes and a rack (Each holding 20 cm³): Hold the same volume of each solution, so the liquid is the same depth in every test.
- Graduated pipettes or syringes (20 cm³ and 10 cm³): Measure the hydrogen peroxide and water accurately when making .
- and thermometer (Set to 25 °C): Keep all solutions at a constant temperature, and check it.
- Stopwatch: Times how long each disc takes to sink and rise.
- Small beaker, labels and paper towels: Hold the potato extract for soaking discs, label the tubes and wipe up spills.
- Eye protection and gloves: Protect eyes and skin from hydrogen peroxide.
Model answer: describe the method
Describe how you would use filter paper discs soaked in potato extract to investigate the effect of hydrogen peroxide concentration on the activity of catalase. Your answer should explain how you would make sure the results are valid and repeatable.
Original practice response · 6 indicative marks
- Make a range of at least five hydrogen peroxide concentrations, such as 4, 8, 12, 16 and 20 vol, by diluting 20 vol hydrogen peroxide with distilled water using graduated pipettes, keeping the total volume at 20 cm³ in identical boiling tubes.
- Make potato extract in 7 and keep the extract and all the tubes in a at 25 °C for 5 minutes before starting.
- Use forceps to soak a filter paper disc, cut with a hole punch, in the potato extract for 10 seconds and drain it for 5 seconds.
- Drop the disc into the hydrogen peroxide, start a stopwatch, and record the time taken for the disc to sink and rise to the surface.
- Repeat three times at each concentration with a fresh disc and fresh solution, calculate the time, and calculate the as 1 ÷ time.
- Keep temperature, , disc size, soaking time and the volume of solution the same in every test.
- Set up a using discs soaked in boiled and cooled potato extract, which should sink and not rise, to show that active produces the oxygen.
What the answer needs to cover
- A range of at least five hydrogen peroxide concentrations made by
- Discs of equal size soaked in extract for a fixed time
- Time for the disc to sink and rise measured as the
- Temperature controlled with a
- controlled with a
- Same volume of solution in identical tubes
- At least three repeats with a and calculated
- A using boiled and cooled potato extract
Method, step by step
- Blend 25 g of peeled potato with 100 cm³ of 7 , filter it, and pour some of the extract into a small beaker. Stir the extract before each use. Why: Blending breaks open cells to release . The keeps constant. Stirring stops the extract settling, which would change the concentration.
- Make 20 cm³ of each hydrogen peroxide concentration in a labelled boiling tube: 4 vol (4 cm³ of 20 vol with 16 cm³ of water), 8 vol (8 cm³ with 12 cm³), 12 vol (12 cm³ with 8 cm³), 16 vol (16 cm³ with 4 cm³) and 20 vol (20 cm³ with no water). Why: Every tube has the same total volume, so the depth of liquid is the same and each disc travels the same distance.
- Stand the tubes and the beaker of extract in the at 25 °C for 5 minutes. Check the temperature with a thermometer. Why: All solutions to the same temperature, so temperature cannot affect the results.
- Using forceps, dip a filter paper disc into the extract for 10 seconds, then hold it against the side of the beaker for 5 seconds to let excess extract drain off. Why: Soaking and draining for fixed times means each disc carries a similar amount of .
- Drop the disc into the 4 vol tube and start the stopwatch as it touches the liquid. Why: Timing starts when the first meets the .
- Stop the stopwatch when the disc returns to the surface. Record the time to the nearest second. Why: The disc sinks, then releases oxygen bubbles that make it float back up. The faster the reaction, the sooner it rises.
- If the disc has not risen after 120 seconds, record that it did not rise within 120 s. Why: A time limit stops a test running indefinitely when the is very low.
- Remove the disc. Repeat twice more with a fresh disc and a fresh 20 cm³ of the same concentration. Why: A fresh solution each time means the concentration is not reduced by earlier discs, and three readings allow a and a check on .
- Repeat steps 4 to 8 for each of the other concentrations. Why: This gives a set of results across the full range of concentrations.
- As a , soak discs in potato extract that has been boiled and cooled, and drop them into 20 vol hydrogen peroxide. Why: Boiling . The discs should sink and not rise, showing that active causes the oxygen production.
- Calculate the time for each concentration and then the as 1 ÷ time. Why: increases as time decreases, which makes the relationship with concentration easier to see on a graph.
Variables
- : Concentration of hydrogen peroxide. 4, 8, 12, 16 and 20 vol, made by diluting 20 vol hydrogen peroxide with distilled water using graduated pipettes. This is the concentration, the only factor deliberately changed. Example: The 12 vol tube contains 12 cm³ of 20 vol hydrogen peroxide and 8 cm³ of water.
- : Time for the disc to sink and rise, used to calculate . Timed with a stopwatch from when the disc touches the liquid to when it reaches the surface. = 1 ÷ time. This measures how quickly produces oxygen.
- : Temperature. All tubes and the extract kept in a at 25 °C. Temperature changes the of the molecules and so the number of .
- : . The potato extract is made in 7 . Changes in alter the charges on in the and would change the .
- : Amount of on each disc. Discs of the same size, cut with a hole punch, soaked for 10 seconds and drained for 5 seconds, using extract from the same batch that is stirred before use. More means more and faster oxygen production.
- : Volume and depth of hydrogen peroxide solution. 20 cm³ in identical boiling tubes. A deeper liquid means the disc has further to travel, which would increase the time without any change in .
- comparison: Discs soaked in boiled and cooled potato extract. Dropped into 20 vol hydrogen peroxide in the same way. This separate test shows that the discs only rise when active is present.
Understanding the variables in this investigation
The is the concentration of hydrogen peroxide, which is the . You change it by diluting the 20 vol stock solution with distilled water. 'Vol' is the unit used for hydrogen peroxide concentration, and a higher number means a more concentrated solution.
The is the time for the disc to sink and rise. The disc rises because releases oxygen, and the bubbles make the disc buoyant. A faster reaction produces enough oxygen sooner, so the time is shorter. That is why the is calculated as 1 ÷ time.
The are the factors that would change how quickly oxygen is released even if the concentration stayed the same. Temperature and affect the itself. The size of the disc and the soaking time affect how much is on each disc. The volume of solution affects how far the disc has to travel.
The uses discs soaked in boiled and cooled extract. It is a separate test, not a . Because boiling , those discs should not rise, which shows that active is responsible for the oxygen.
Why the disc sinks and then rises
- A disc soaked in extract is denser than the solution, so it sinks.
- on the disc breaks down hydrogen peroxide into water and oxygen.
- Oxygen bubbles collect on the fibres of the disc.
- When enough oxygen has collected, the disc becomes less dense than the solution and rises.
- More means more per second, so oxygen collects faster and the disc rises sooner, until all the are occupied.
Changing the method to investigate enzyme concentration
- Keep the hydrogen peroxide at a single high concentration, such as 20 vol, in every tube, so that is in excess. concentration is now a .
- Make different concentrations of potato extract by diluting it with 7 , for example 20, 40, 60, 80 and 100% extract. For 40% extract, mix 4 cm³ of extract with 6 cm³ of .
- Dilute with instead of water so that the stays the same in every concentration.
- Soak discs in each extract concentration for the same time, and time how long they take to sink and rise, with three repeats at each concentration.
- Expect the to increase in direct proportion to the extract concentration, giving a straight line, because more means more while the is in excess.
Substrate concentration or enzyme concentration: what is different?
- In the version you dilute the hydrogen peroxide and keep the extract the same. In the version you dilute the extract and keep the hydrogen peroxide the same.
- In the version the graph of rises and then levels off, because all the become occupied. In the version the graph is a straight line, as long as stays in excess.
- In the version the levels off because concentration becomes . In the version the would only level off if the ran short.
- Both versions temperature, , disc size, soaking time and the volume of solution.
Another method: collecting the oxygen
- Instead of discs, mix potato extract with hydrogen peroxide in a conical flask connected to a gas syringe or an upturned measuring cylinder filled with water.
- Measure the volume of oxygen collected in a fixed time, such as 30 seconds, and calculate the in cm³ s⁻¹.
- WJEC used this method in its 2024 Unit 1 paper. A gas syringe measures volume more accurately than counting bubbles or reading an upturned cylinder.
- The same variables still need controlling: temperature, , volume and concentration of extract, and the volume of hydrogen peroxide.
Results and analysis
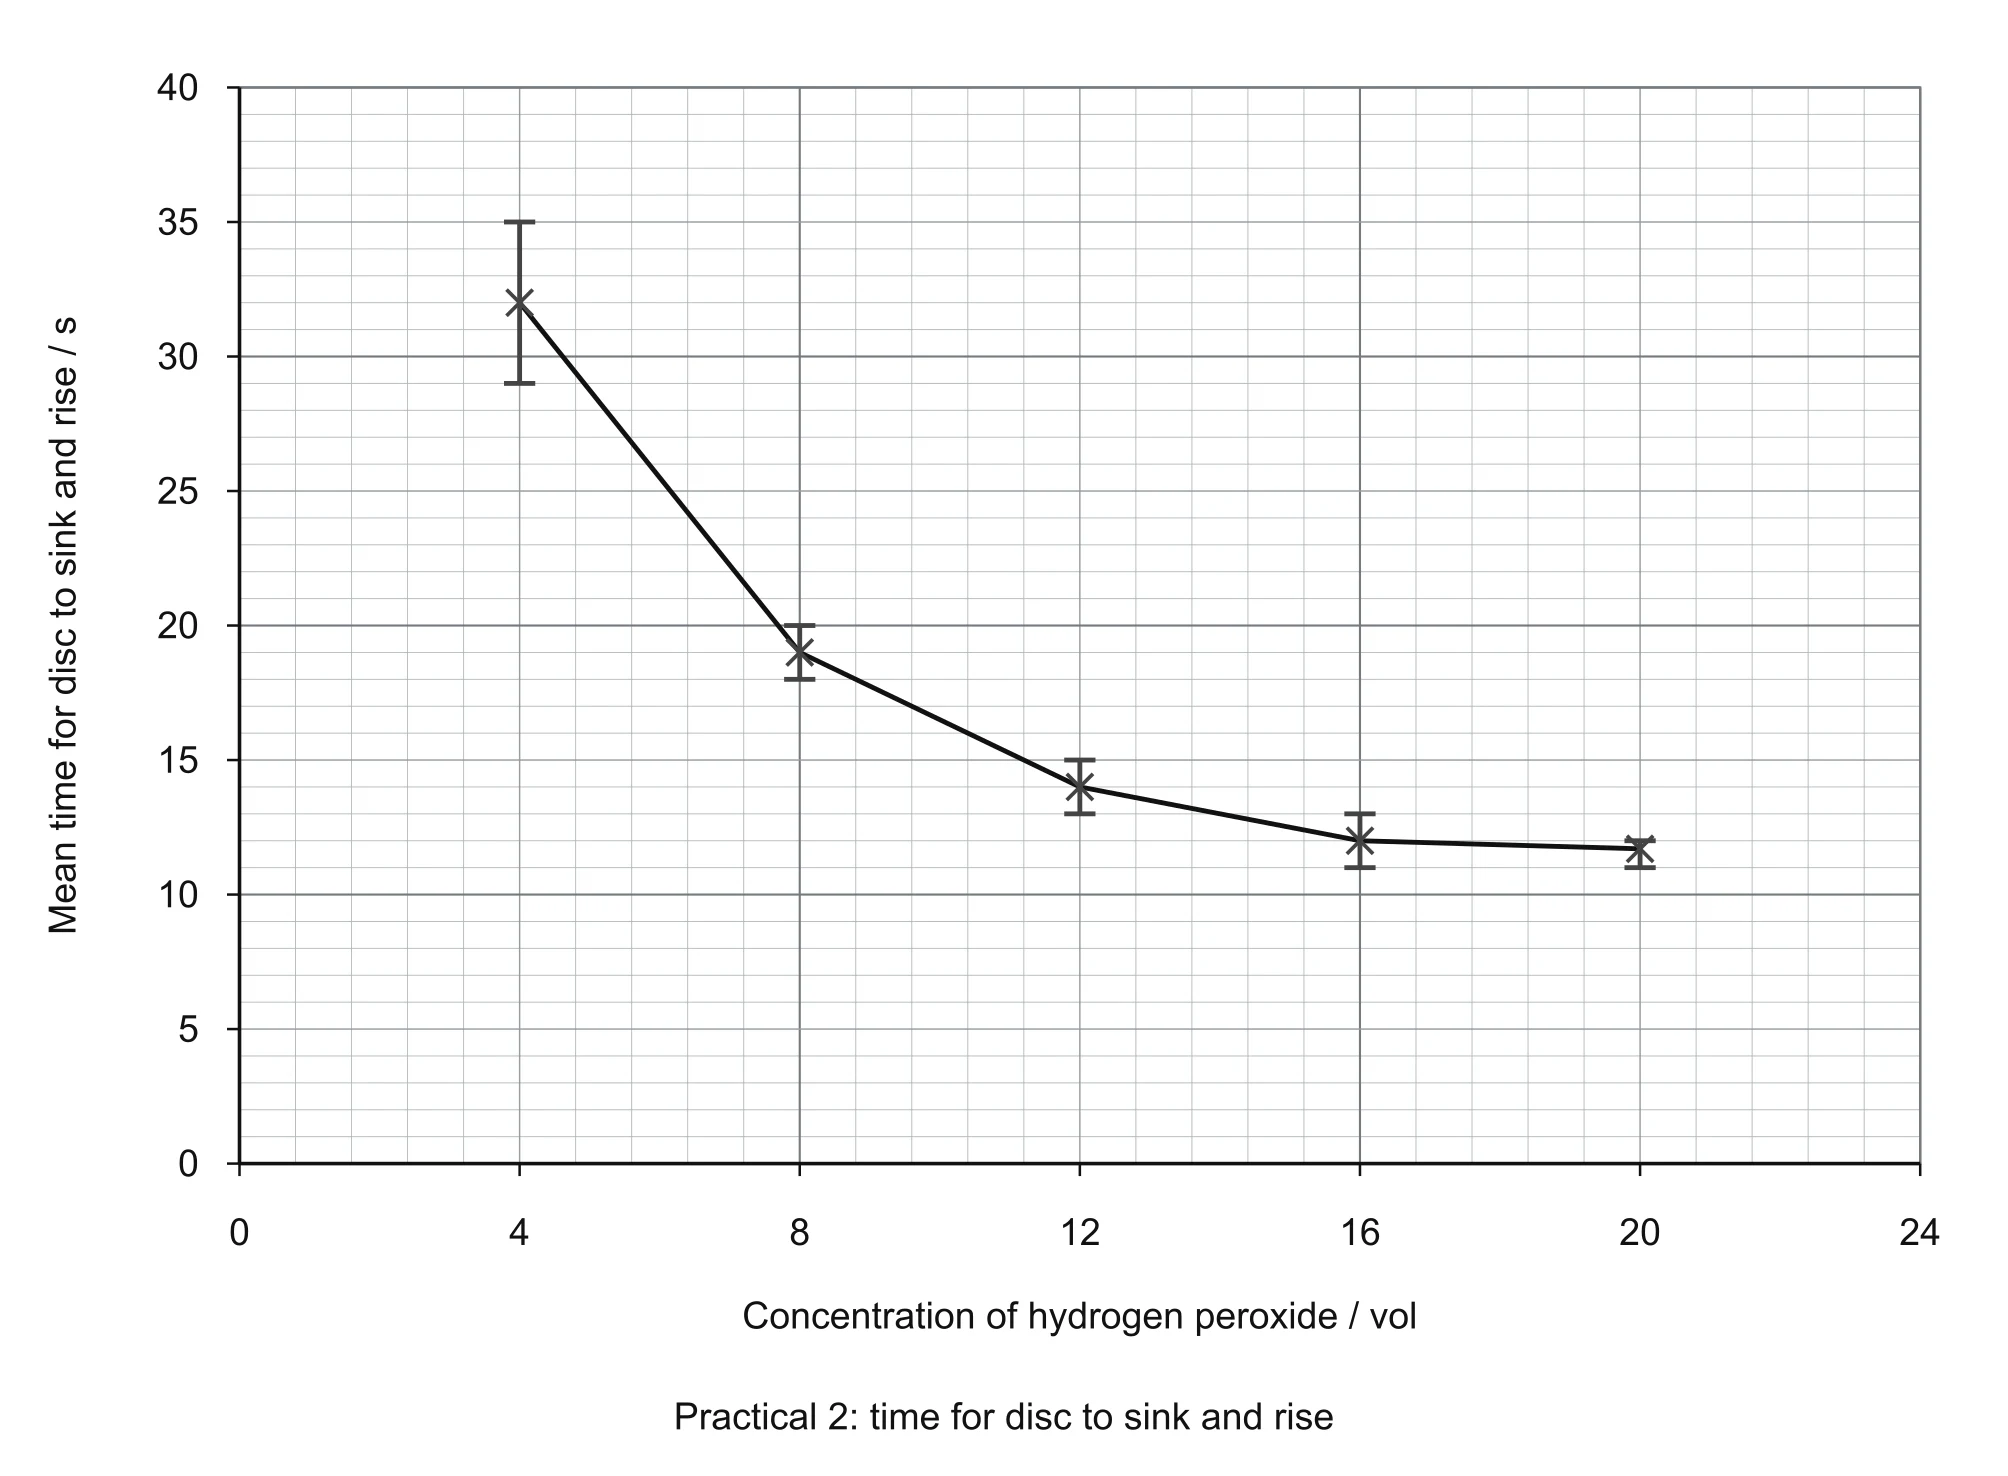
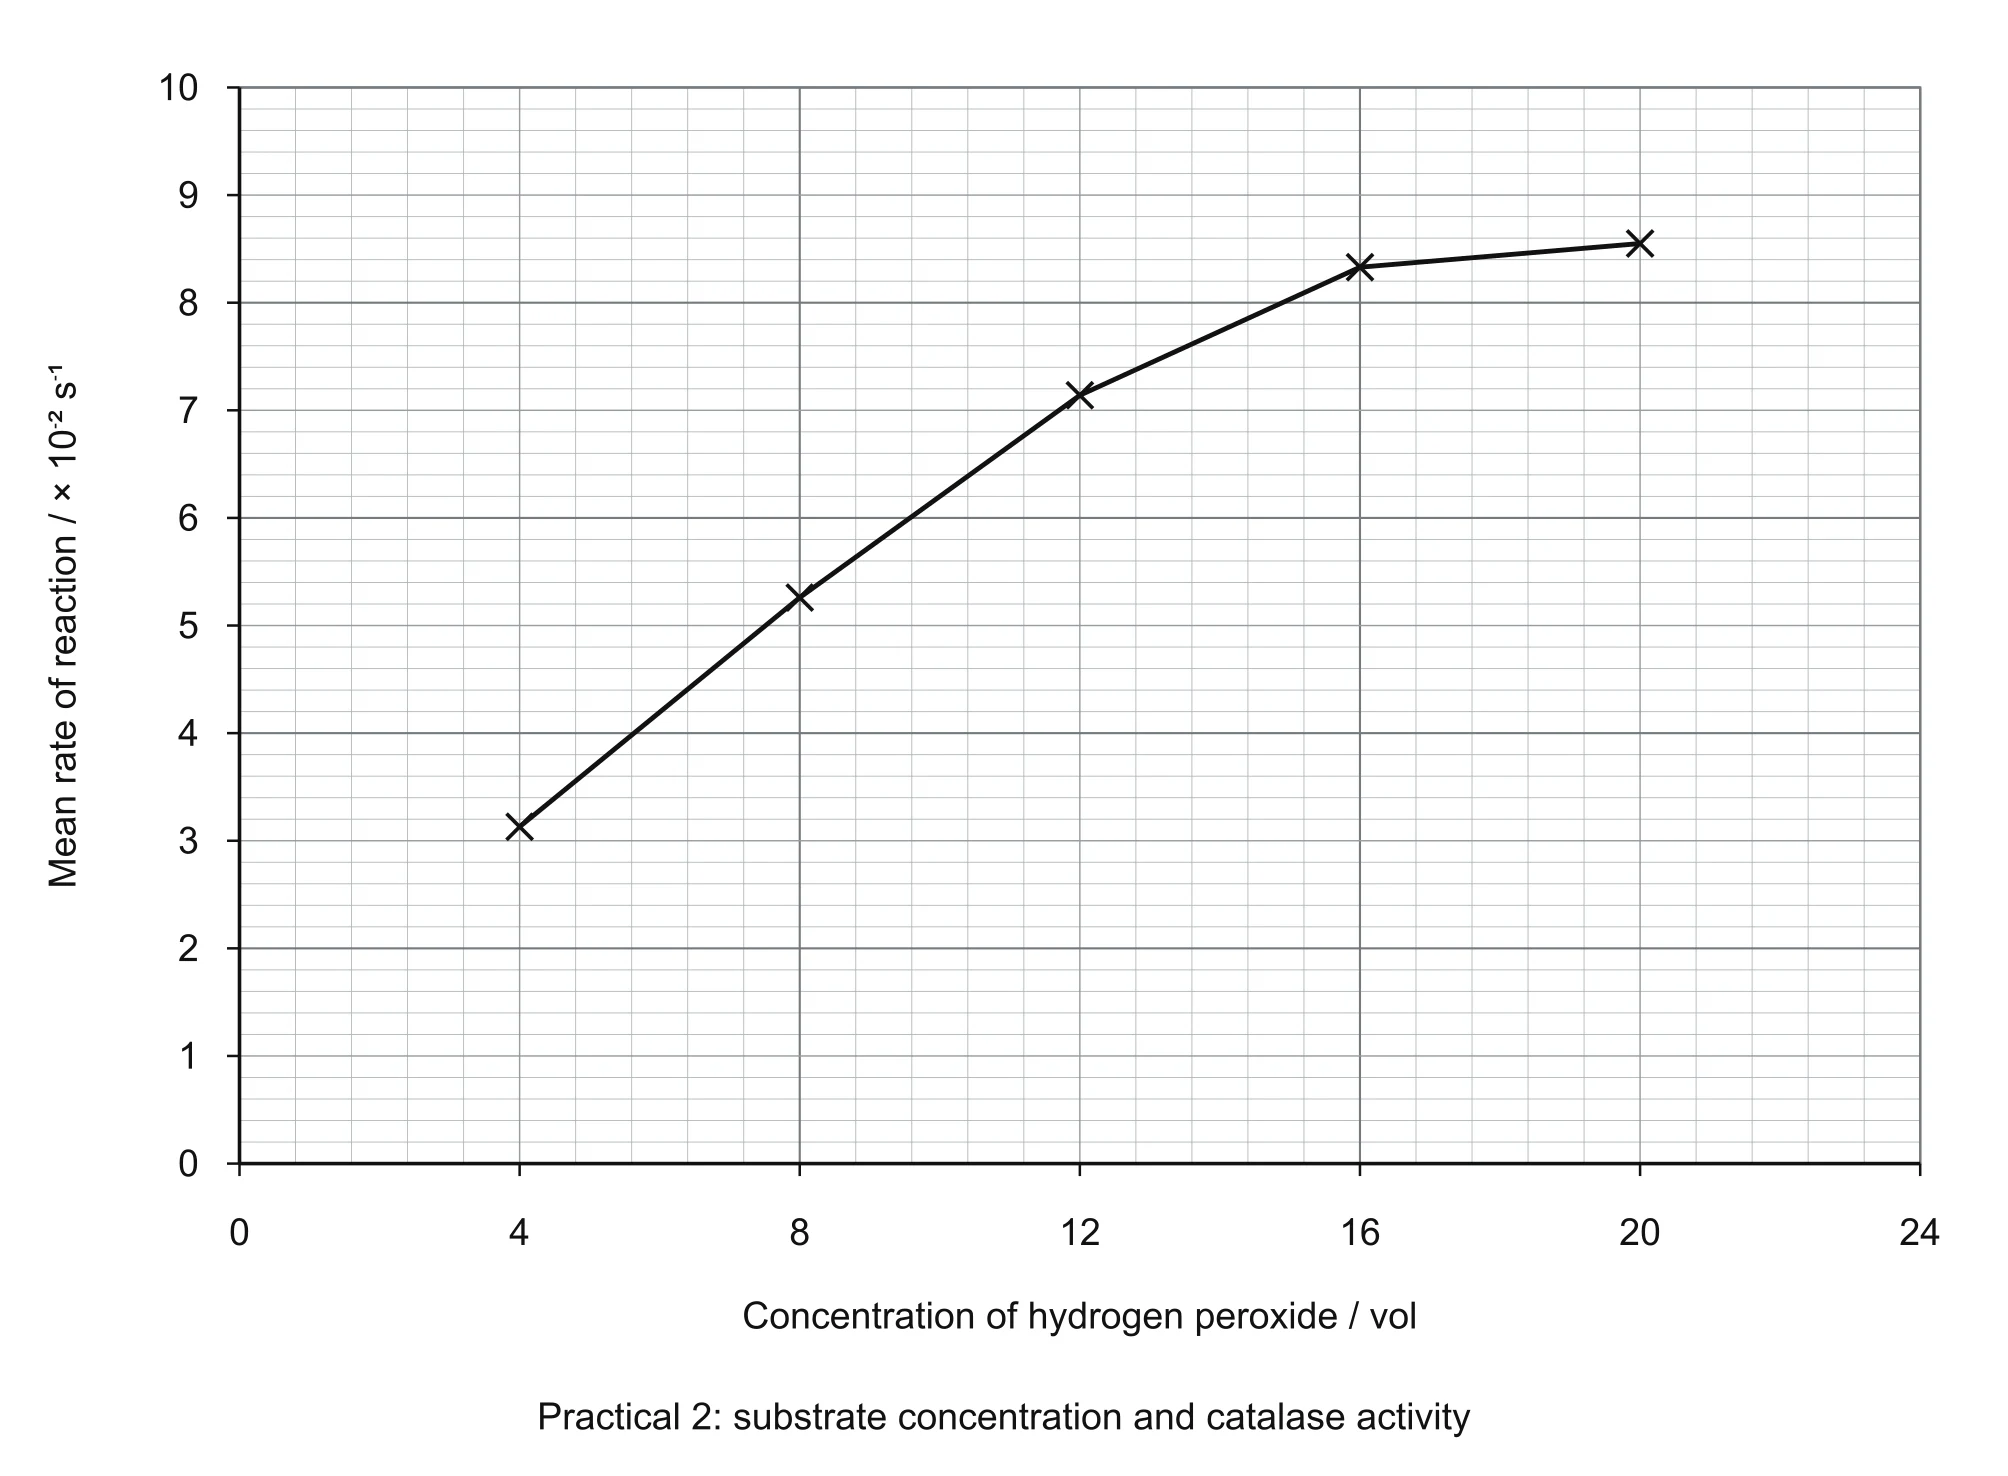
Any example results below are illustrative. Two graphs are useful. The first shows time on the y axis against hydrogen peroxide concentration on the x axis, with from the shortest to the longest repeat. The time falls quickly from 32.0 s at 4 vol to 14.0 s at 12 vol, then only slightly to 11.7 s at 20 vol. The second shows against concentration. The increases from 3.13 × 10⁻² s⁻¹ at 4 vol to 7.14 × 10⁻² s⁻¹ at 12 vol, then levels off, reaching only 8.55 × 10⁻² s⁻¹ at 20 vol. At low concentrations, hydrogen peroxide is the . Adding more causes more and more . At high concentrations, the concentration of is the because nearly all the are occupied. The are longest at 4 vol, where the three times cover 6 s, and shortest at 20 vol, where they cover only 1 s. This means the readings at higher concentrations were more . Discs soaked in boiled extract did not rise, so the oxygen was produced by active . time at 20 vol = (12 + 11 + 12) ÷ 3 = 11.7 s (1 decimal place) at 20 vol = 1 ÷ 11.7 = 0.0855 = 8.55 × 10⁻² s⁻¹ Volume of 20 vol stock needed for 20 cm³ of 12 vol = (12 ÷ 20) × 20 cm³ = 12 cm³, made up with 8 cm³ of distilled water
Evaluation
Different discs may carry different amounts of potato extract. A disc with more releases oxygen faster and rises sooner, making times vary for reasons other than concentration. Improvement: Cut all discs with the same hole punch, soak and drain each for exactly the same time, and stir the extract before each use. It is hard to judge the exact moment the disc reaches the surface, and discs sometimes stick to the side of the tube or rise at an angle. Timings become less and less . Improvement: Use wider tubes so discs do not touch the sides, discard and repeat any trial where the disc sticks, and take more repeats. If the investigation is carried out on the bench, room temperature can change during the practical. Temperature changes and so the , making the comparison between concentrations unfair. Improvement: Carry out all tests in a . If the same tube of hydrogen peroxide is used for repeat readings, some has already been broken down and bubbles remain in the liquid. Later repeats would be slower or less consistent than the first. Improvement: Use a fresh 20 cm³ of solution for each repeat. There are only five concentrations, 4 vol apart, and the curve levels off between 12 vol and 20 vol. It is difficult to judge exactly where the stops increasing. Improvement: Add extra concentrations between 12 vol and 20 vol, for example every 2 vol.
Safety
Hydrogen peroxide solution (20 vol): Irritates the eyes and skin and can bleach clothing. : Wear eye protection and gloves, wash any splashes off skin with plenty of water and wipe up spills. Blender blades and knife used to prepare the potato: Can cause cuts. : Cut on a tile away from your fingers and switch off and unplug the blender before removing the jug. Boiling the extract for the : Boiling liquid and steam can cause burns. : Use tongs or a test tube holder and wear eye protection. Glass boiling tubes: Broken glass can cause cuts. : Check for chips before use and report any breakages.
Exam practice
Use your knowledge of enzymes to describe and explain the effect of hydrogen peroxide concentration on the rate of reaction.
As the concentration of hydrogen peroxide increases, the increases and then levels off. At lower concentrations, hydrogen peroxide is the , so increasing its concentration leads to more and more . At higher concentrations, the concentration of is the , because all the are occupied. The increases and then levels off At low concentrations is the and more form At high concentrations concentration is because all are occupied
Suggest a suitable control for this experiment, describe the expected results and state the purpose of the control.
Use discs soaked in potato extract that has been boiled and then cooled. The discs would sink but would not rise. This shows that the discs only rise because active breaks down hydrogen peroxide to release oxygen. Boiled and cooled potato extract Discs sink but do not rise Shows that is responsible for breaking down the hydrogen peroxide
Describe how you would change this method to investigate the effect of enzyme concentration on the activity of catalase.
Dilute the potato extract with 7 to make a range of concentrations, such as 20, 40, 60, 80 and 100%. Keep the hydrogen peroxide at 20 vol in every tube so that is in excess. Keep everything else the same, including temperature, disc size, soaking time and the volume of solution, and measure the time for each disc to sink and rise. Make a range of extract concentrations by Keep hydrogen peroxide concentration constant and in excess Keep other variables the same and measure the same
Copper sulfate is a non-competitive inhibitor of catalase. Describe how the results would be different if copper sulfate were added to the potato extract, and explain why.
The times would be longer, so the rates would be lower, at every concentration. The would still level off, but at a lower . Copper ions bind to a site other than the and change the shape of the , so adding more hydrogen peroxide cannot overcome the . Longer times or lower rates at each concentration The levels off at a lower maximum The changes the shape of the , so more does not overcome it
Use the range bars to comment on the repeatability of the results.
The at 4 vol is the longest, covering 29 s to 35 s, so the repeat readings at this concentration were the least . The at 16 vol and 20 vol are short, covering 2 s or less, so those readings were more and the means at higher concentrations are more reliable. Compares the length of at different concentrations using values Links shorter to more readings
Scroll sideways to view all columns.
| Concentration of hydrogen peroxide / vol | Trial 1 time / s | Trial 2 time / s | Trial 3 time / s | Mean time / s | Mean rate / × 10⁻² s⁻¹ |
|---|---|---|---|---|---|
| 0 (distilled water) | no rise in 120 s | no rise in 120 s | no rise in 120 s | not calculated | 0 |
| 4 | 32 | 35 | 29 | 32.0 | 3.13 |
| 8 | 18 | 20 | 19 | 19.0 | 5.26 |
| 12 | 13 | 15 | 14 | 14.0 | 7.14 |
| 16 | 12 | 13 | 11 | 12.0 | 8.33 |
| 20 | 12 | 11 | 12 | 11.7 | 8.55 |
 Open full size
  Open full size
 Scroll sideways to view all columns.
| Feature | Substrate concentration version | Enzyme concentration version |
|---|---|---|
| Hydrogen peroxide concentration: 4, 8, 12, 16 and 20 vol | Potato extract concentration: 20, 40, 60, 80 and 100% | |
| How it is made | Dilute 20 vol hydrogen peroxide with distilled water | Dilute potato extract with 7 |
| Kept constant | Concentration of potato extract | Hydrogen peroxide concentration, kept at 20 vol so is in excess |
| Expected pattern | rises, then levels off | increases in proportion, giving a straight line |
| Main biological explanation | limits the at first, then all become occupied | More gives more and more per second |
Scroll sideways to view all columns.
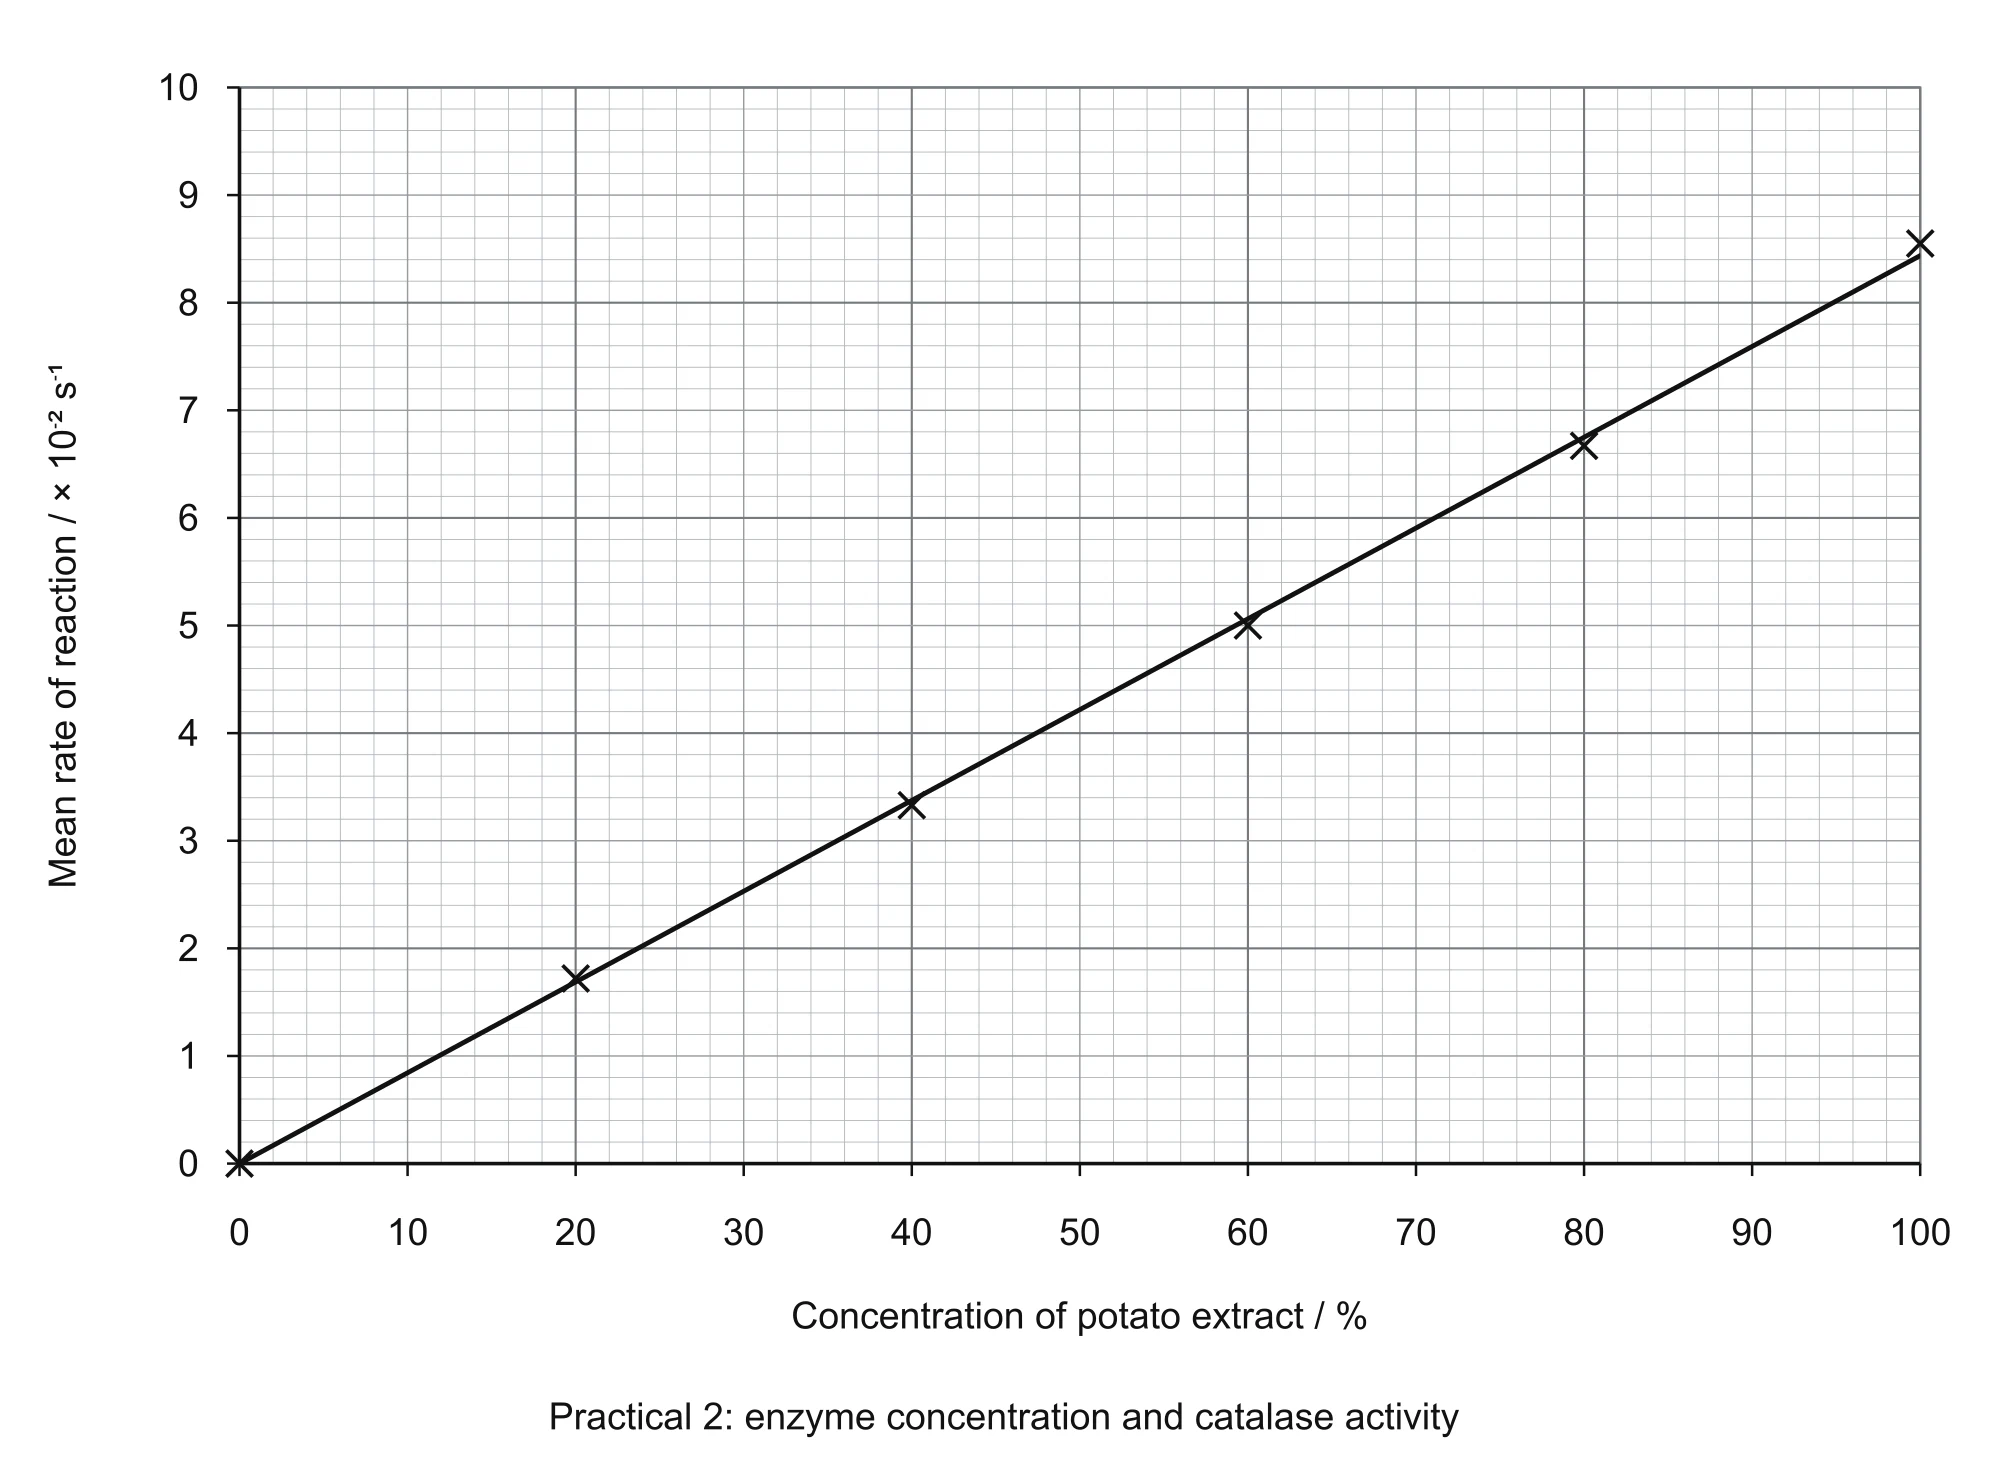
| Concentration of potato extract / % | Trial 1 time / s | Trial 2 time / s | Trial 3 time / s | Mean time / s | Mean rate / × 10⁻² s⁻¹ |
|---|---|---|---|---|---|
| 0 | no rise in 120 s | no rise in 120 s | no rise in 120 s | not calculated | 0 |
| 20 | 58 | 62 | 54 | 58.0 | 1.72 |
| 40 | 30 | 28 | 32 | 30.0 | 3.33 |
| 60 | 21 | 19 | 20 | 20.0 | 5.00 |
| 80 | 15 | 16 | 14 | 15.0 | 6.67 |
| 100 | 12 | 11 | 12 | 11.7 | 8.55 |
 Open full size
 Plotted against extract concentration, these rates lie close to a straight line through the origin. Each extra 20% of extract adds roughly 1.7 × 10⁻² s⁻¹ to the . This fits the idea that, with in excess, doubling the number of roughly doubles the number of formed each second.
Enzymes summary: everything in one place
Use this section to check your understanding before trying the questions. If any row feels unfamiliar, go back to that section of the notes first.
Scroll sideways to view all columns.
| Specification point | What you must be able to explain | Words that earn marks |
|---|---|---|
| (a) | is a series of reactions, each controlled by its own | , controlled |
| (b) Protein nature | are whose gives the its shape | , , hydrogen and ionic bonds |
| (c) Where act | act inside cells, are secreted and act outside | , , secreted |
| (d) | The has a shape that is to the | , , |
| (e) | The changes shape as the binds, as in | , strain on bonds, , |
| (f) | lower the , so reactions are fast at body temperature | , lower, alternative pathway |
| (g) Factors | How temperature, , and concentration change , and why are used | , , , , |
| (h) | bind the ; change its shape from another site | Competes, similar shape, different site, |
| (i) | can be reused, do not contaminate the and are more stable | Reuse, stability, |
- Enzymes
- Structure
- Globular protein with tertiary structure
- Active site complementary to substrate
- How they work
- Lock and key model
- Induced fit, for example lysozyme
- Lower activation energy
- Factors affecting rate
- Temperature
- pH and buffers
- Substrate and enzyme concentration
- Competitive and non-competitive inhibitors
- Uses
- Immobilised enzymes in industry
- Structure
The whole topic as one chain of ideas
- 1. Sequence of amino acids
- 2.
- 3. shaped
- 4. binds
- 5. forms
- 6. is lowered
- 7. are released and the is reused
- are , not killed, and cold makes them , not .
- The is to the , not the same shape as it.
- A is to the , not to the .
- A keeps temperature constant. It does not keep the at its .
- A keeps constant.
- A levelled-off is constant, not stopped.
- A is not the same as a .
- Quote values from graphs instead of saying 'before' or 'after' the .
Check your understanding.
One question at a time. Check your reasoning before moving on.
The flow below shows part of a metabolic pathway in a yeast cell. A mutation means the cell can no longer make a functional version of enzyme 2. Which statement describes the most likely effect on the pathway?
- A metabolic pathway in a yeast cell
- Substance P
- Enzyme 1 converts P into Q
- Enzyme 2 converts Q into R
- Enzyme 3 converts R into S
1 mark
Need a refresher? Read the full explanation ↗Your answers stay in this tab while this page is open.