
Explore this topic step by step.
Enzymes
High-yield WJEC AS Biology cram notes on covering every specification point and both specified practicals, with the exact wording that earns marks.
On this page
What is metabolism?
is all of the chemical reactions in a cell or organism. The reactions are linked in , where the of one reaction is the for the next. Each step is by its own , which is why is described as a series of controlled reactions.
A
- 1. Molecule A is the starting
- 2. 1 converts A into B
- 3. 2 converts B into C
- 4. 3 converts C into the final D
What are enzymes made of?
are . The sequence of amino acids () decides how the chain folds. Hydrogen bonds, ionic bonds, disulfide bonds and hydrophobic interactions hold the chain in a precise three dimensional . The gives the its exact shape.
Why structure matters
- 1.
- 2. Bonds between
- 3.
- 4. shape
- 5. Which fits
Do enzymes work inside or outside cells?
Scroll sideways to view all columns.
| Type | Where it acts | Examples |
|---|---|---|
| Inside the cell that made it | , DNA polymerase, respiration | |
| Outside the cell, after being secreted by exocytosis | , trypsin, in tears |
What is an active site and why are enzymes specific?
The is a small region of the with a shape, created by its . The has a shape. When and collide successfully, the binds to form an . Because only a fits, each is . In the the is rigid, like a lock that fits one key.
action
- 1.
- 2.
- 3.
- 4. released, reused
What is the induced fit theory?
In the , the changes shape slightly as the binds, moulding tightly around it. This puts strain on bonds in the , so they break more easily and the is lowered.
, the example in the specification
- 1. Cell wall polysaccharide enters the groove shaped
- 2. closes around it ()
- 3. strained and
- 4. Cell wall weakened
- 5. Water enters by and the bacterium bursts
How do enzymes speed up reactions?
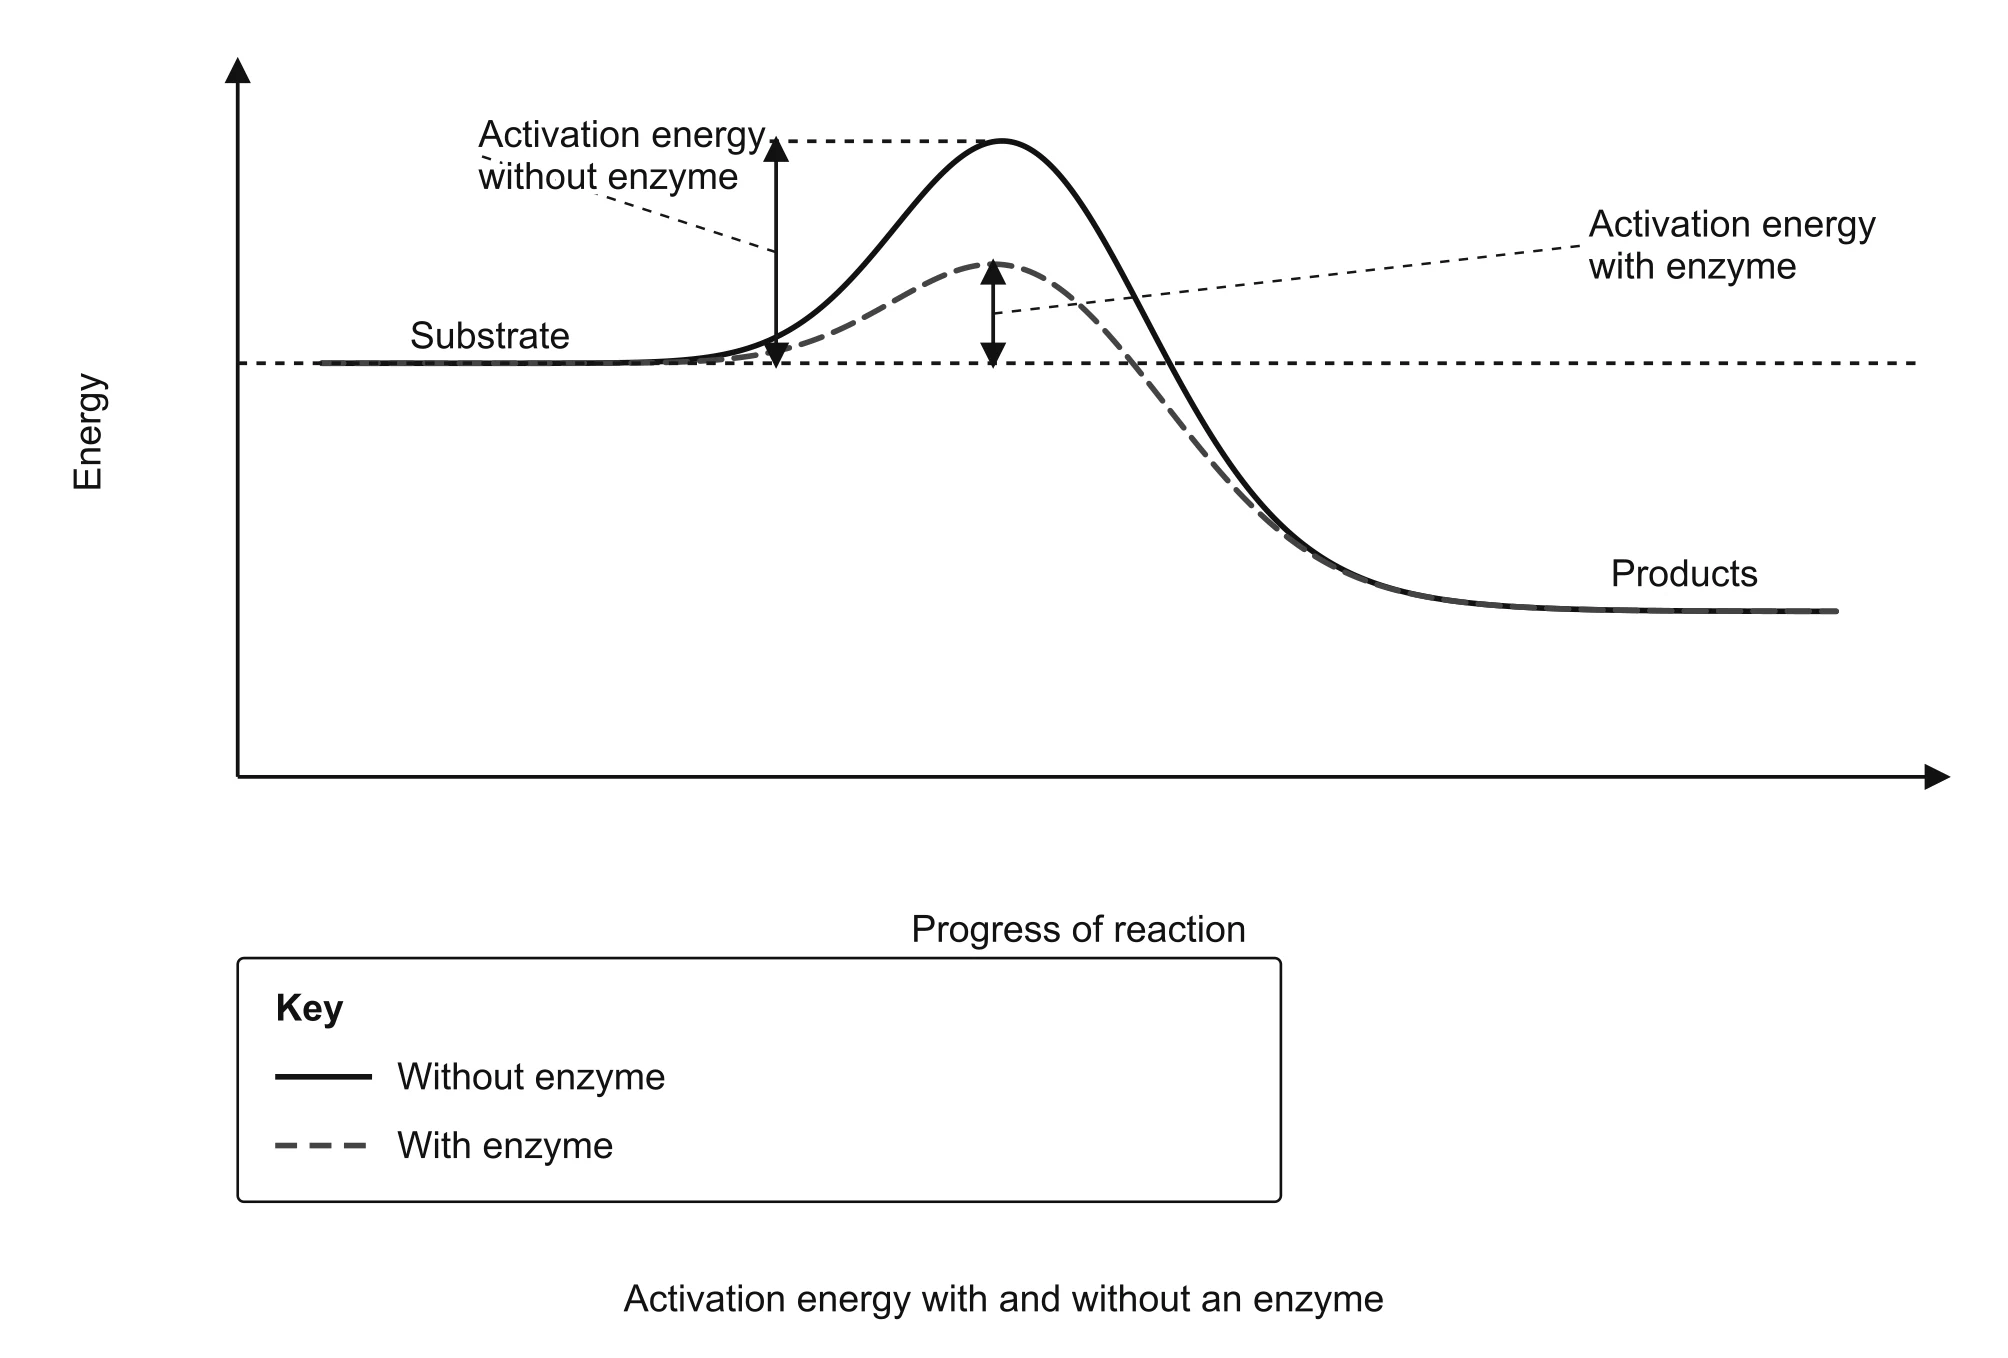
means speeding up a reaction without the being used up. is the minimum energy needed to start a reaction. provide a different reaction pathway with a lower , so reactions are fast enough at body temperature without heating the cell.
 Open full size
 - Both curves start at the same energy and finish at the same energy.
- is measured from the level to the top of the hump.
- The curve has a lower hump. Nothing else changes.
How do we measure the rate of an enzyme reaction?
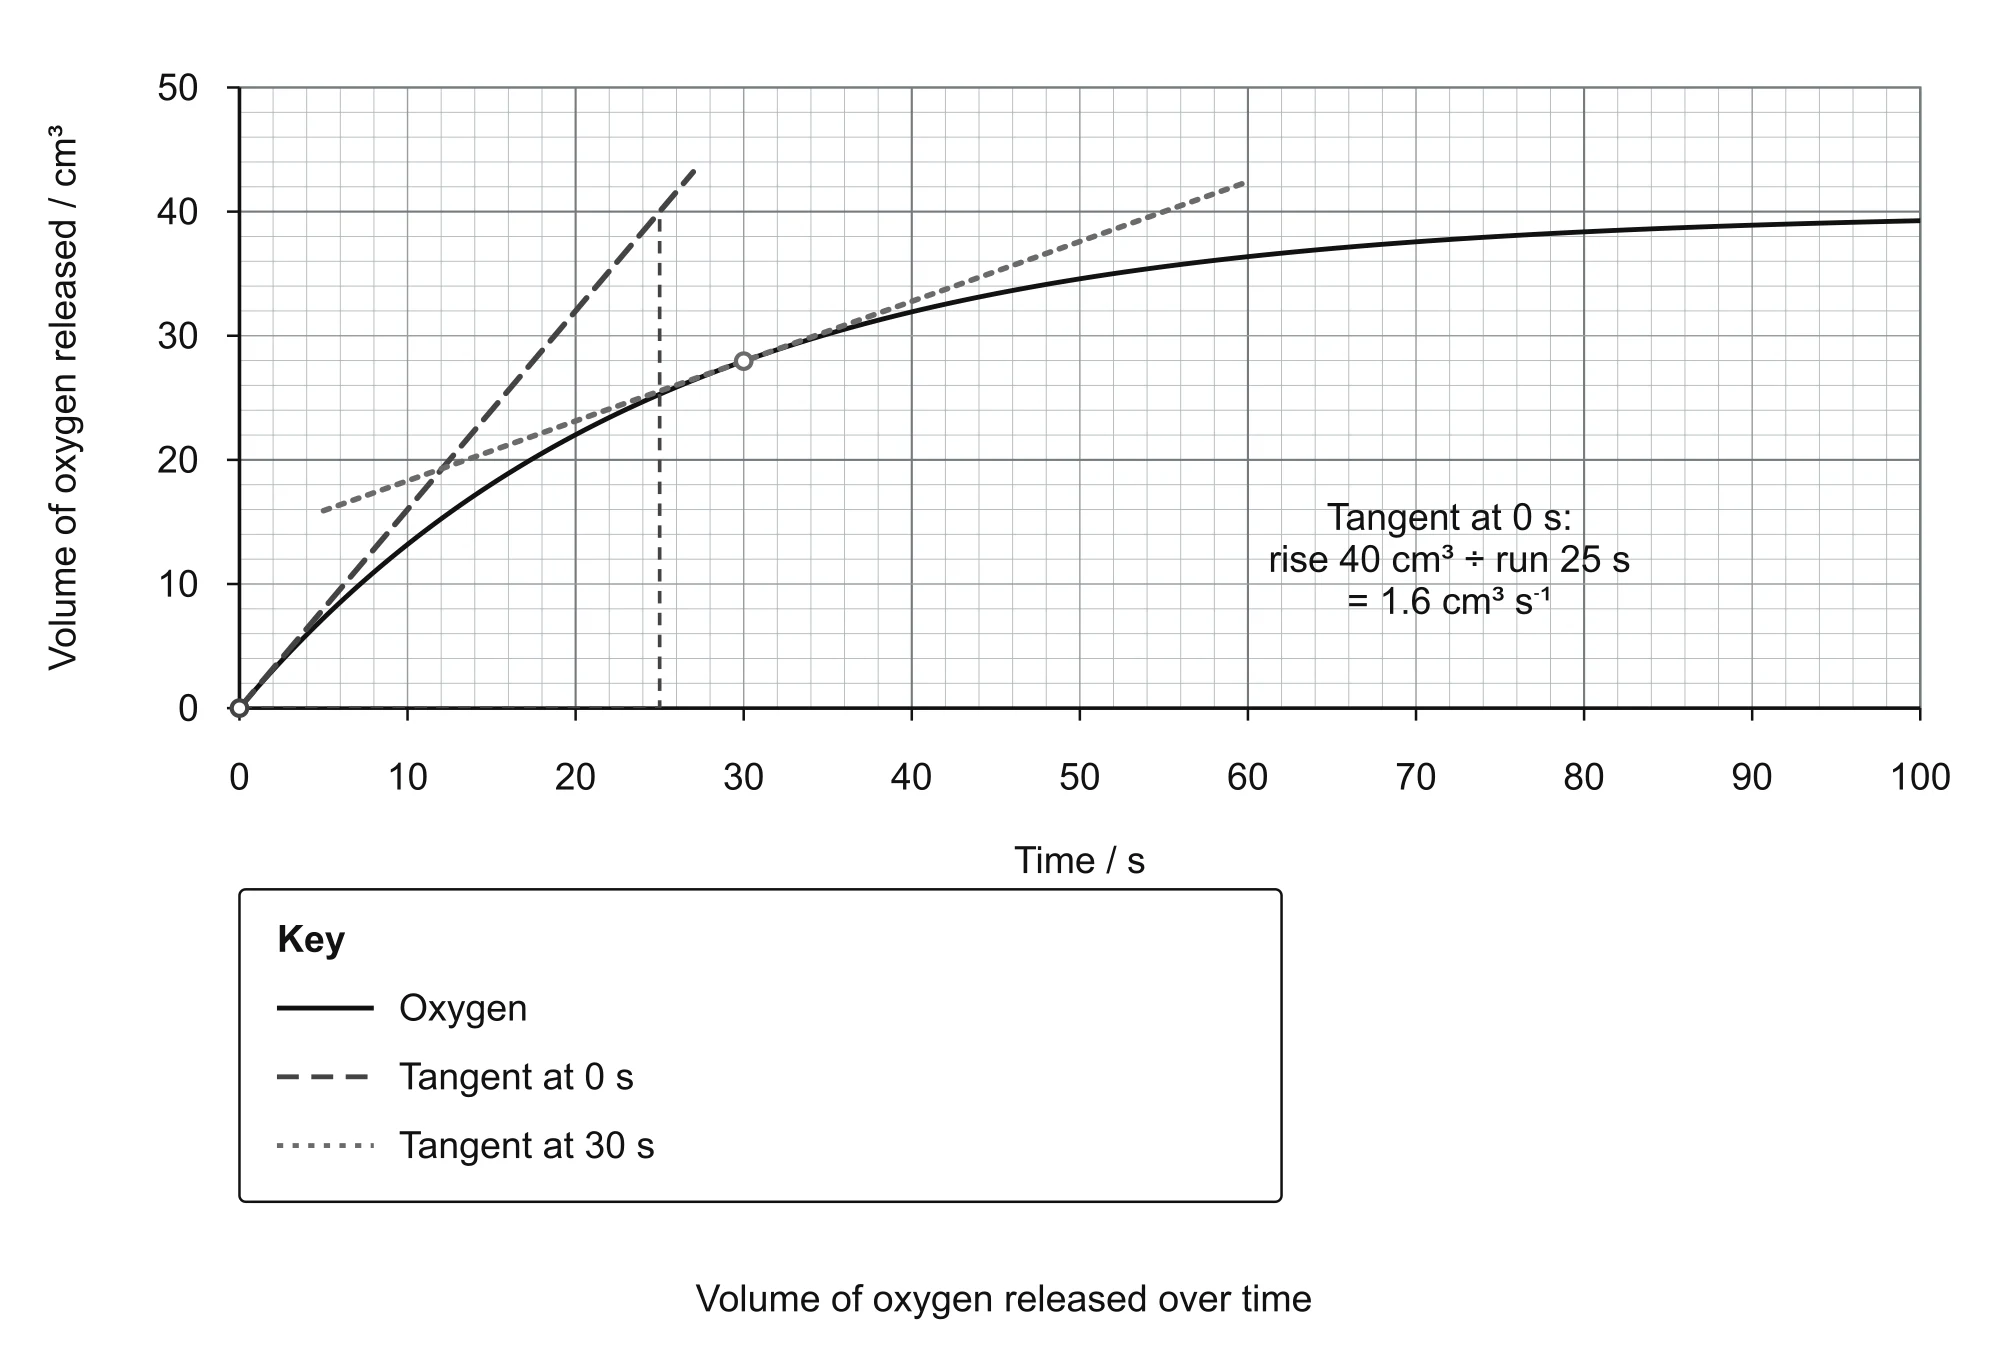
is the amount of made, or used, per unit time. Measure a volume of gas over time, the time taken to reach an , or a colour change with a . When only a time is measured, = 1 ÷ time.
A graph of against time is steepest at the start, because concentration is highest. It becomes less steep as is used up and goes flat when all the has been used. Find the at any time by drawing a and calculating its .
 Open full size
 How does temperature affect enzyme activity?
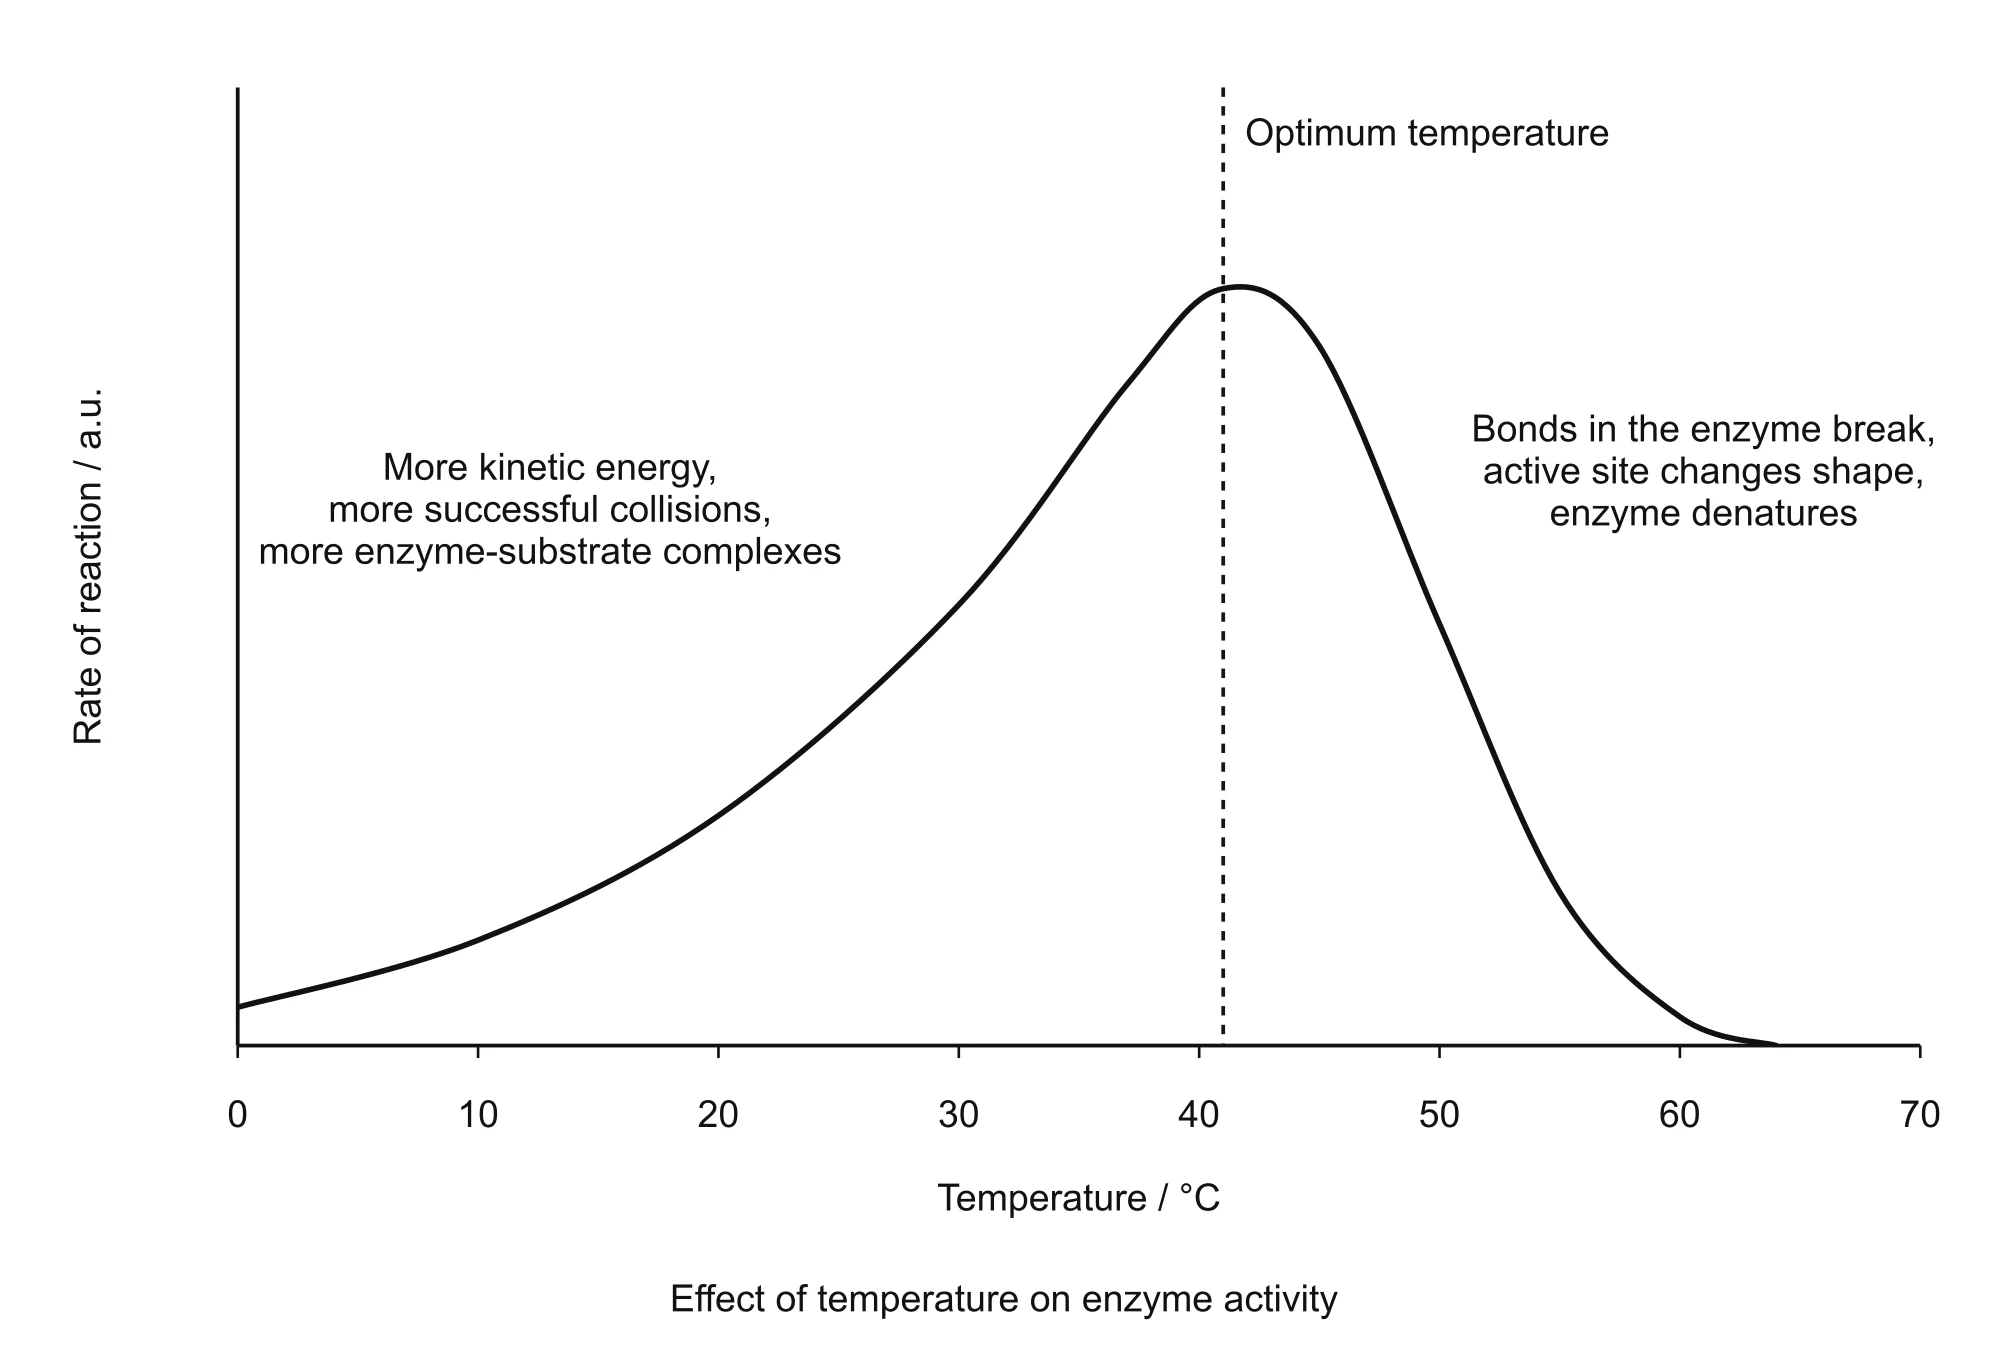
- Below the : more means more and more , so increases.
- At the : is highest. Many human have an near 37 °C.
- Above the : hydrogen and ionic bonds in the break, the changes shape and is no longer . The is and falls steeply.
- Low temperature: the is but not , and works again when warmed.
 Open full size
 How does pH affect enzymes, and what does a buffer do?
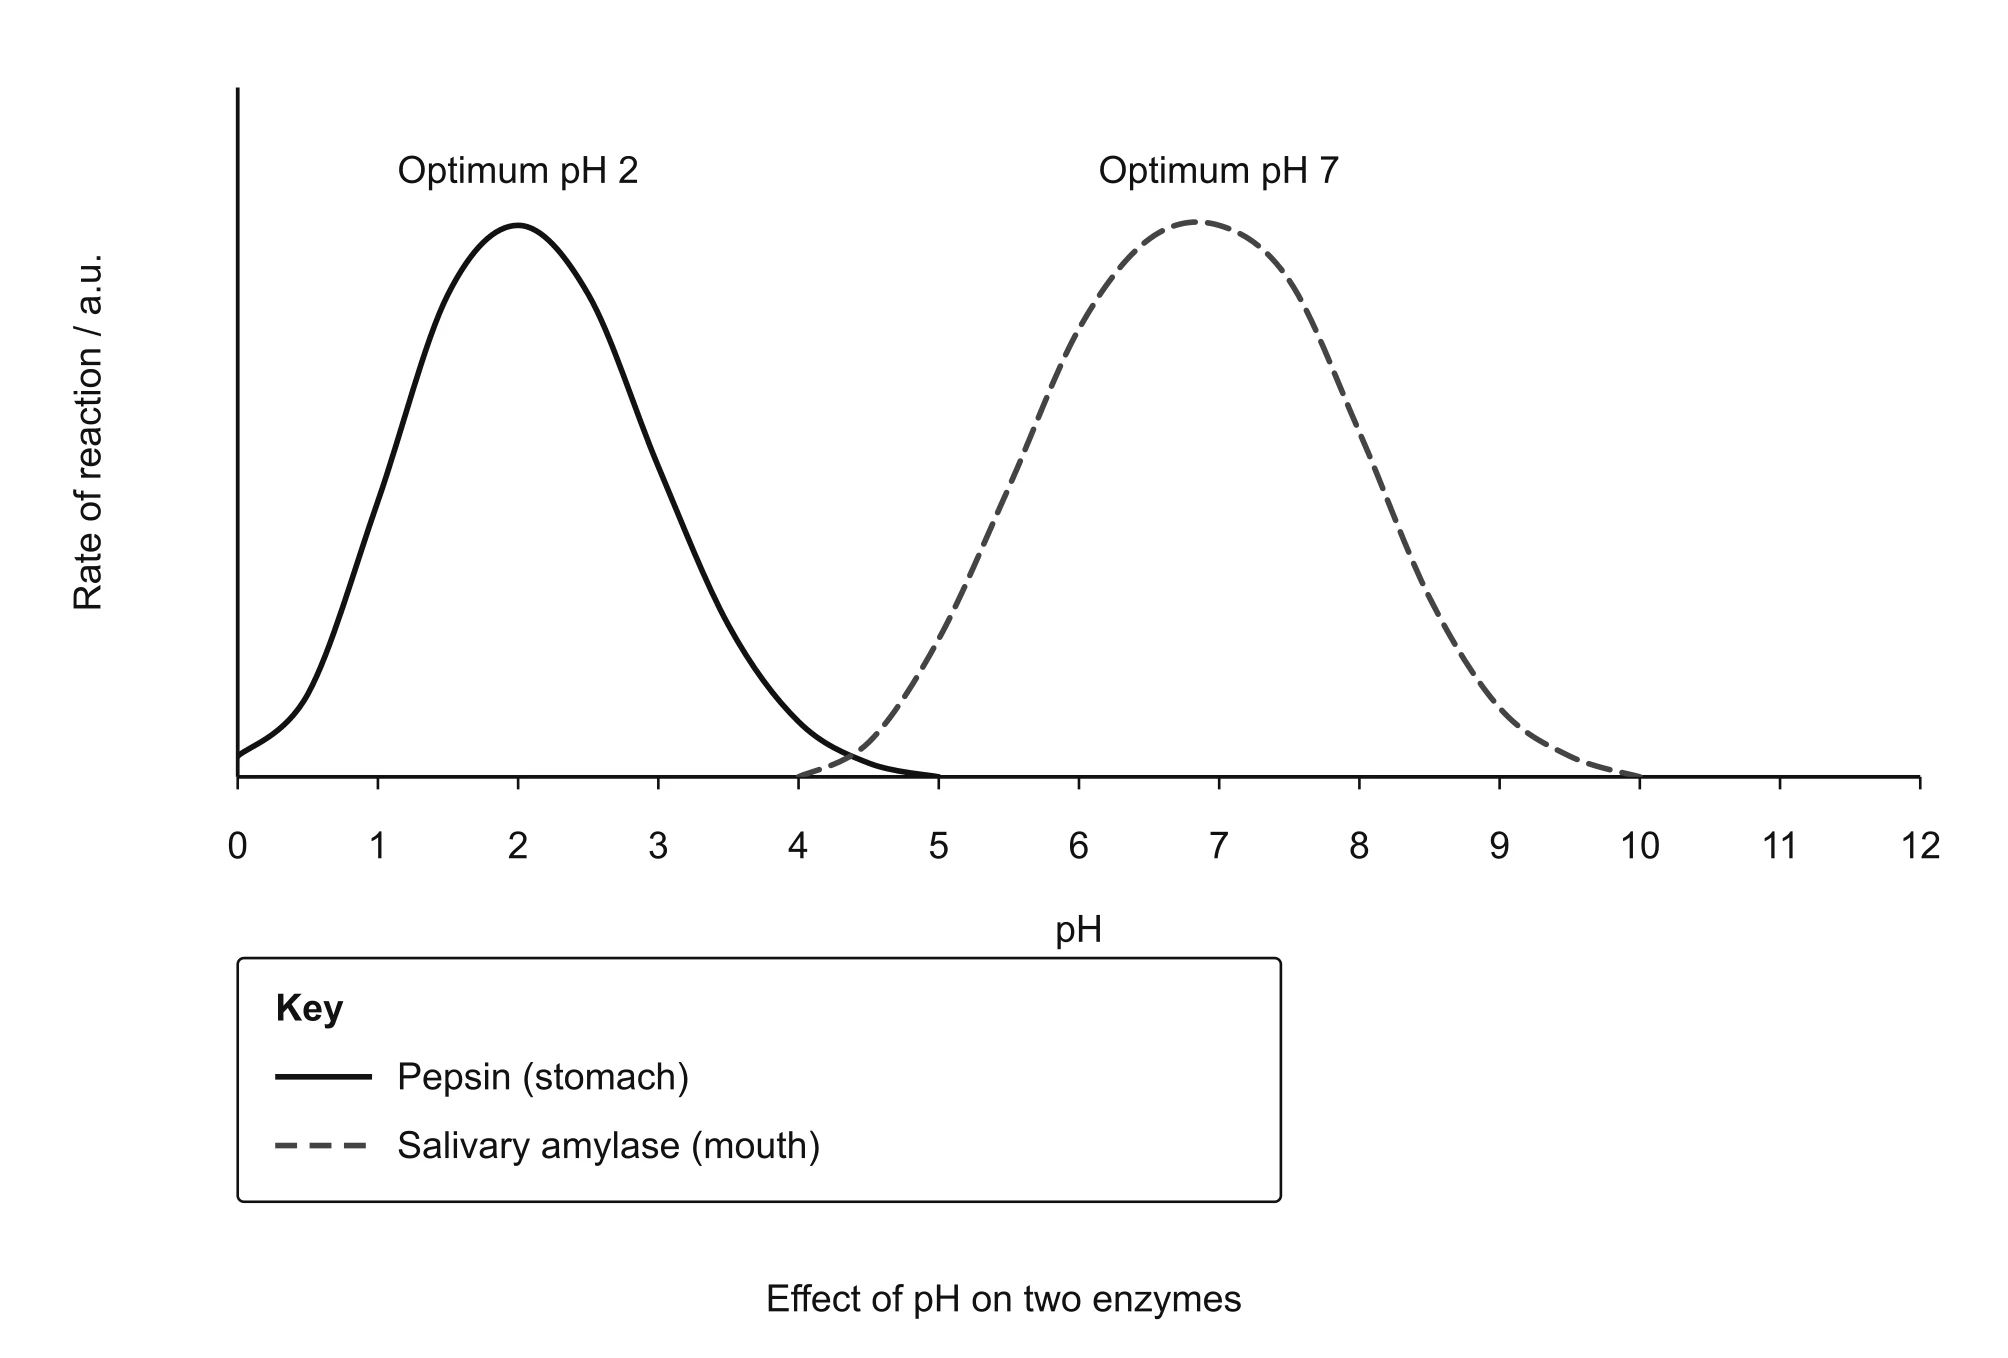
A change in changes the charges on . This affects how the binds in the and, at extreme , breaks the ionic and hydrogen bonds holding the , so the is . Each has its own : pepsin about 2, about 7, trypsin about 8.
 Open full size
 A resists changes in , so it keeps constant. In experiments this stops changing the , so any difference is caused by the variable being tested.
How does substrate concentration affect rate?
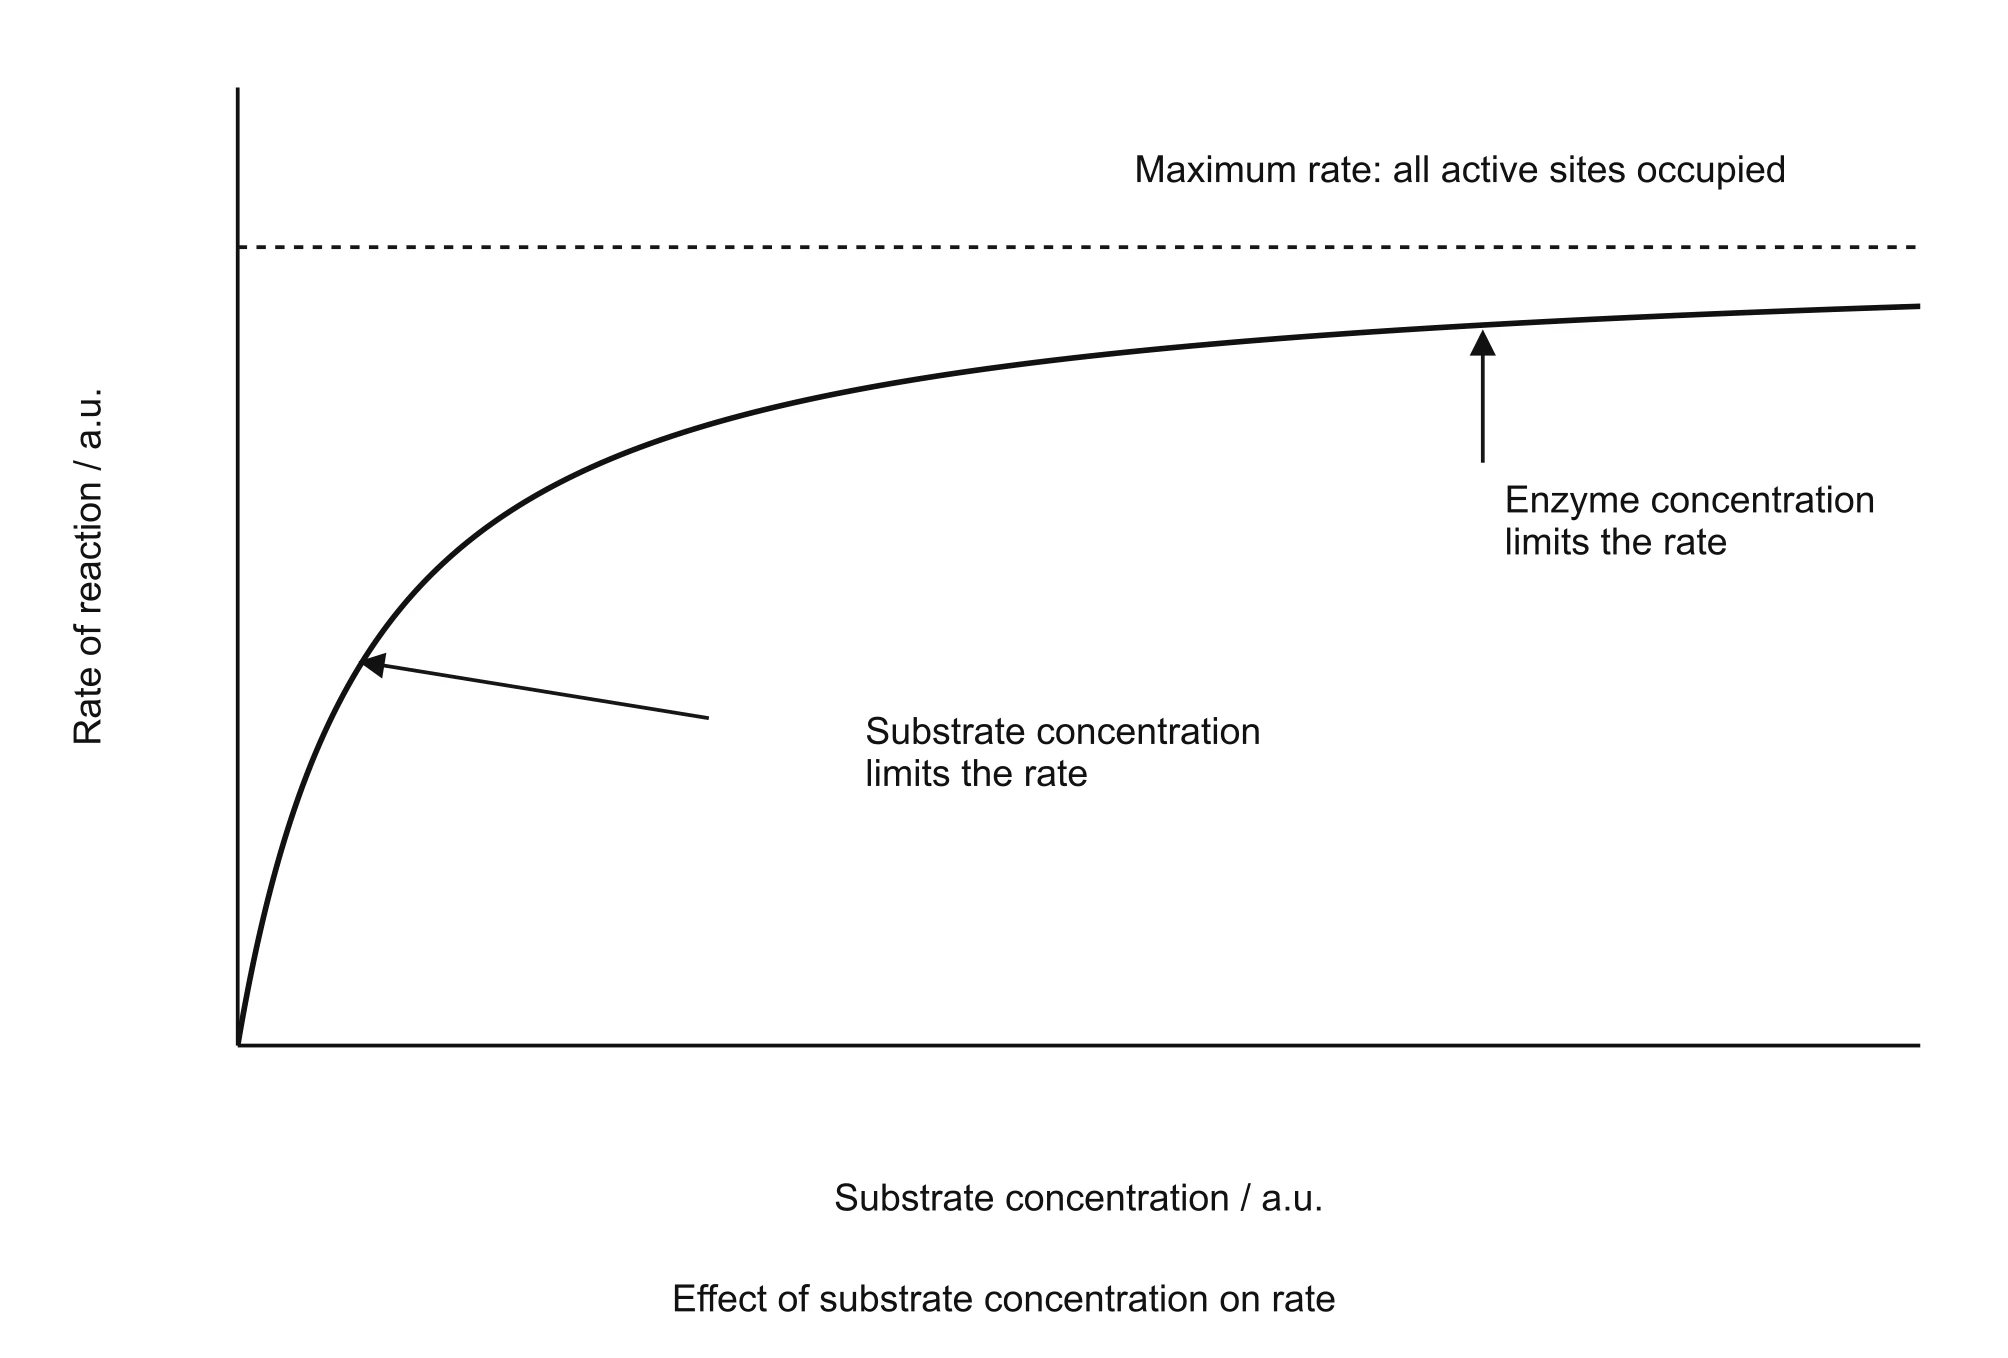
With a fixed amount of , increases as concentration increases, because more form. Here concentration is the . At high concentrations all the are occupied, so the levels off at its maximum. Now concentration is the .
 Open full size
 How does enzyme concentration affect rate?
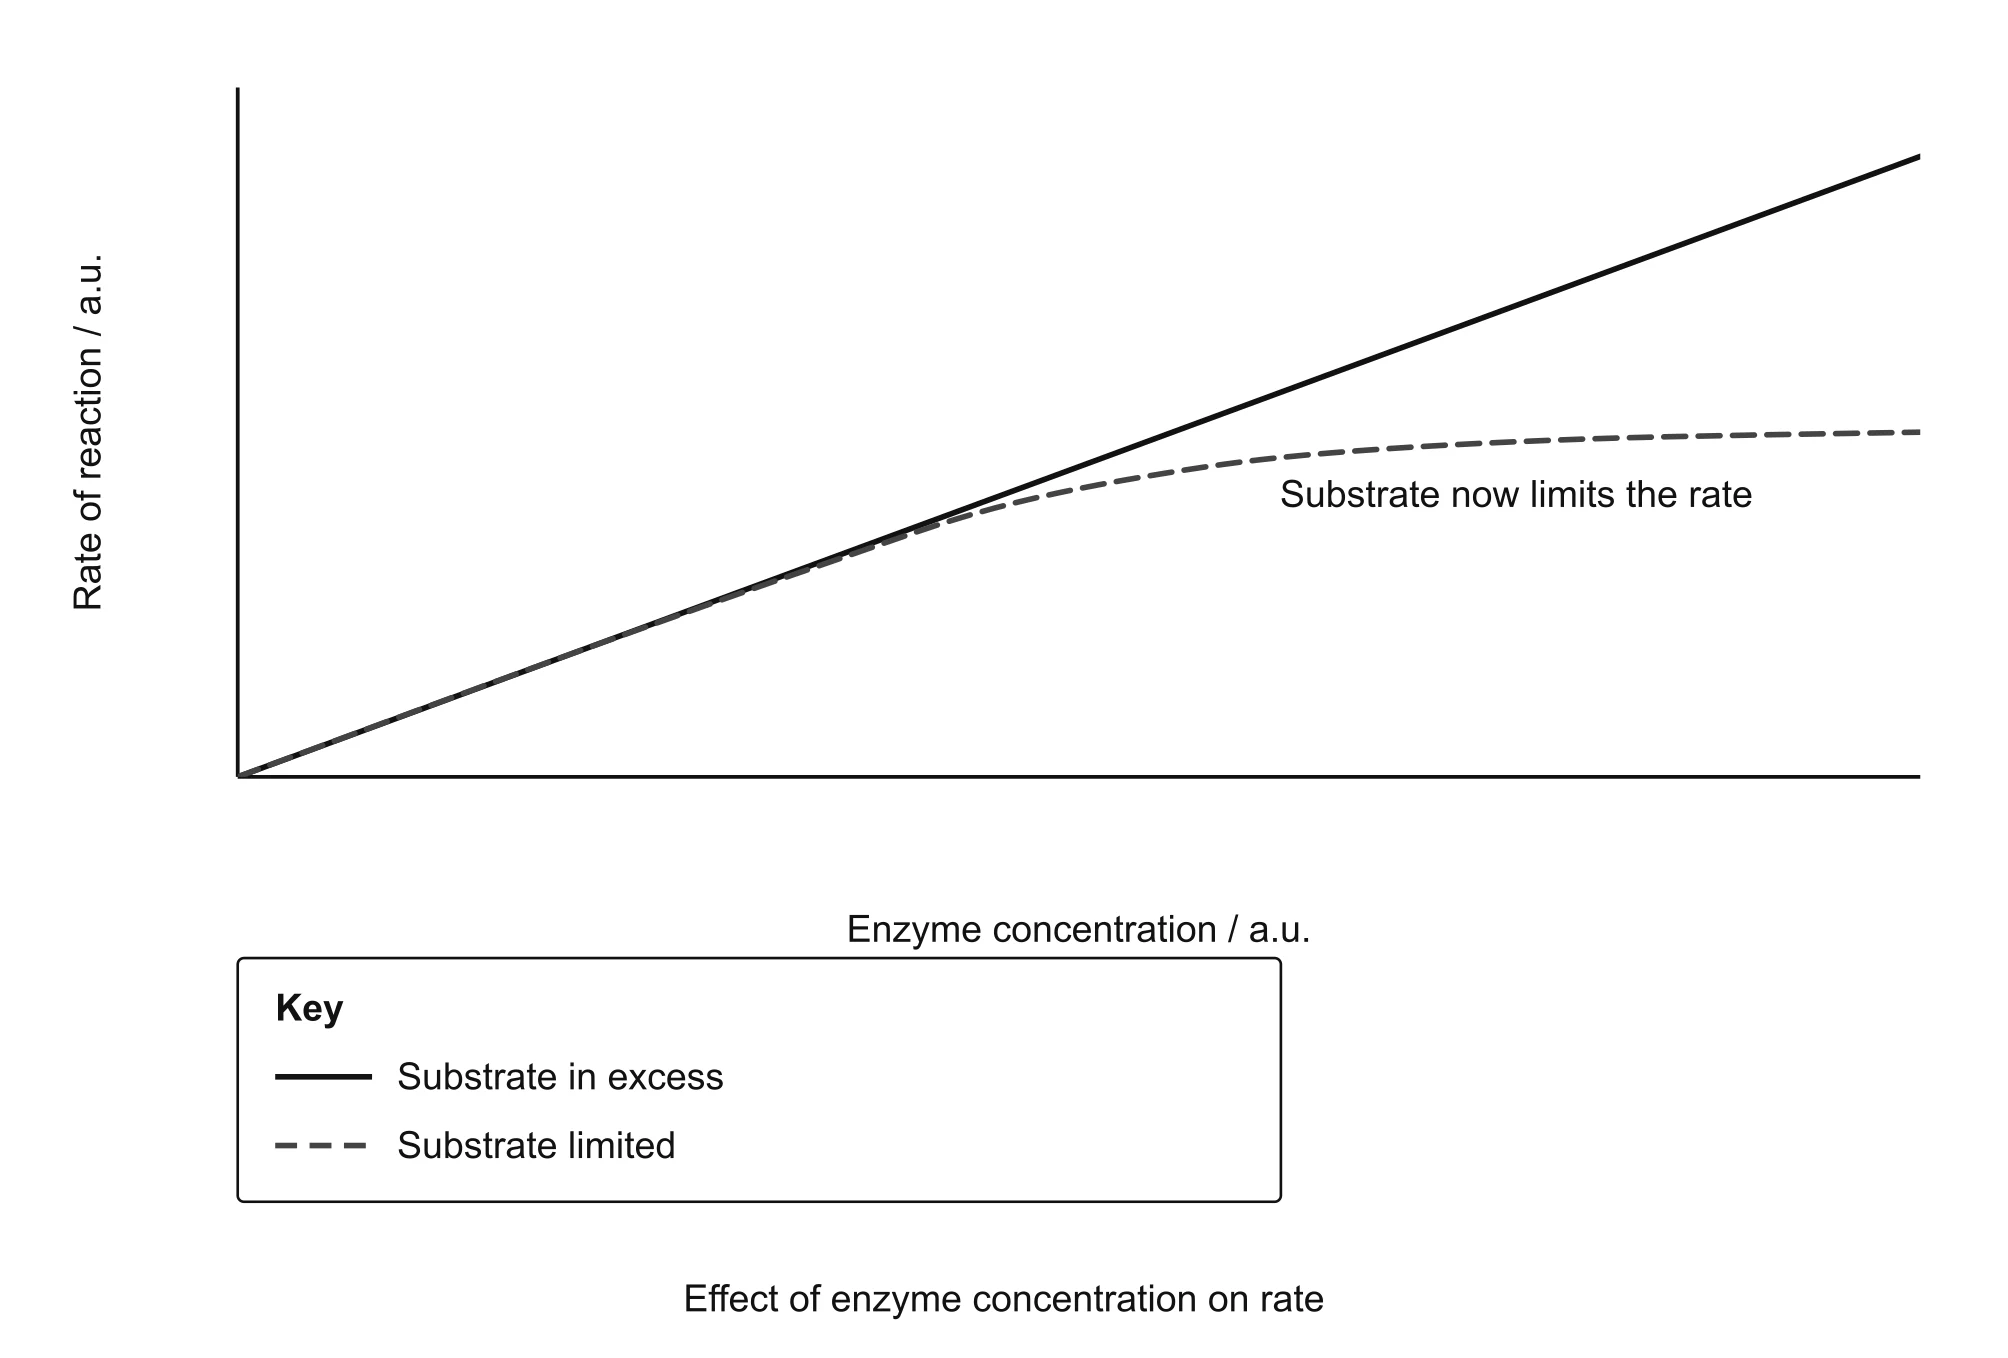
When is in excess, increasing concentration gives more , so increases in direct proportion and the graph is a straight line. If is limited, the levels off because there is not enough to fill the extra . concentration is then the .
 Open full size
 What are competitive and non-competitive inhibitors?
Scroll sideways to view all columns.
| Feature | Competitive | Non-competitive |
|---|---|---|
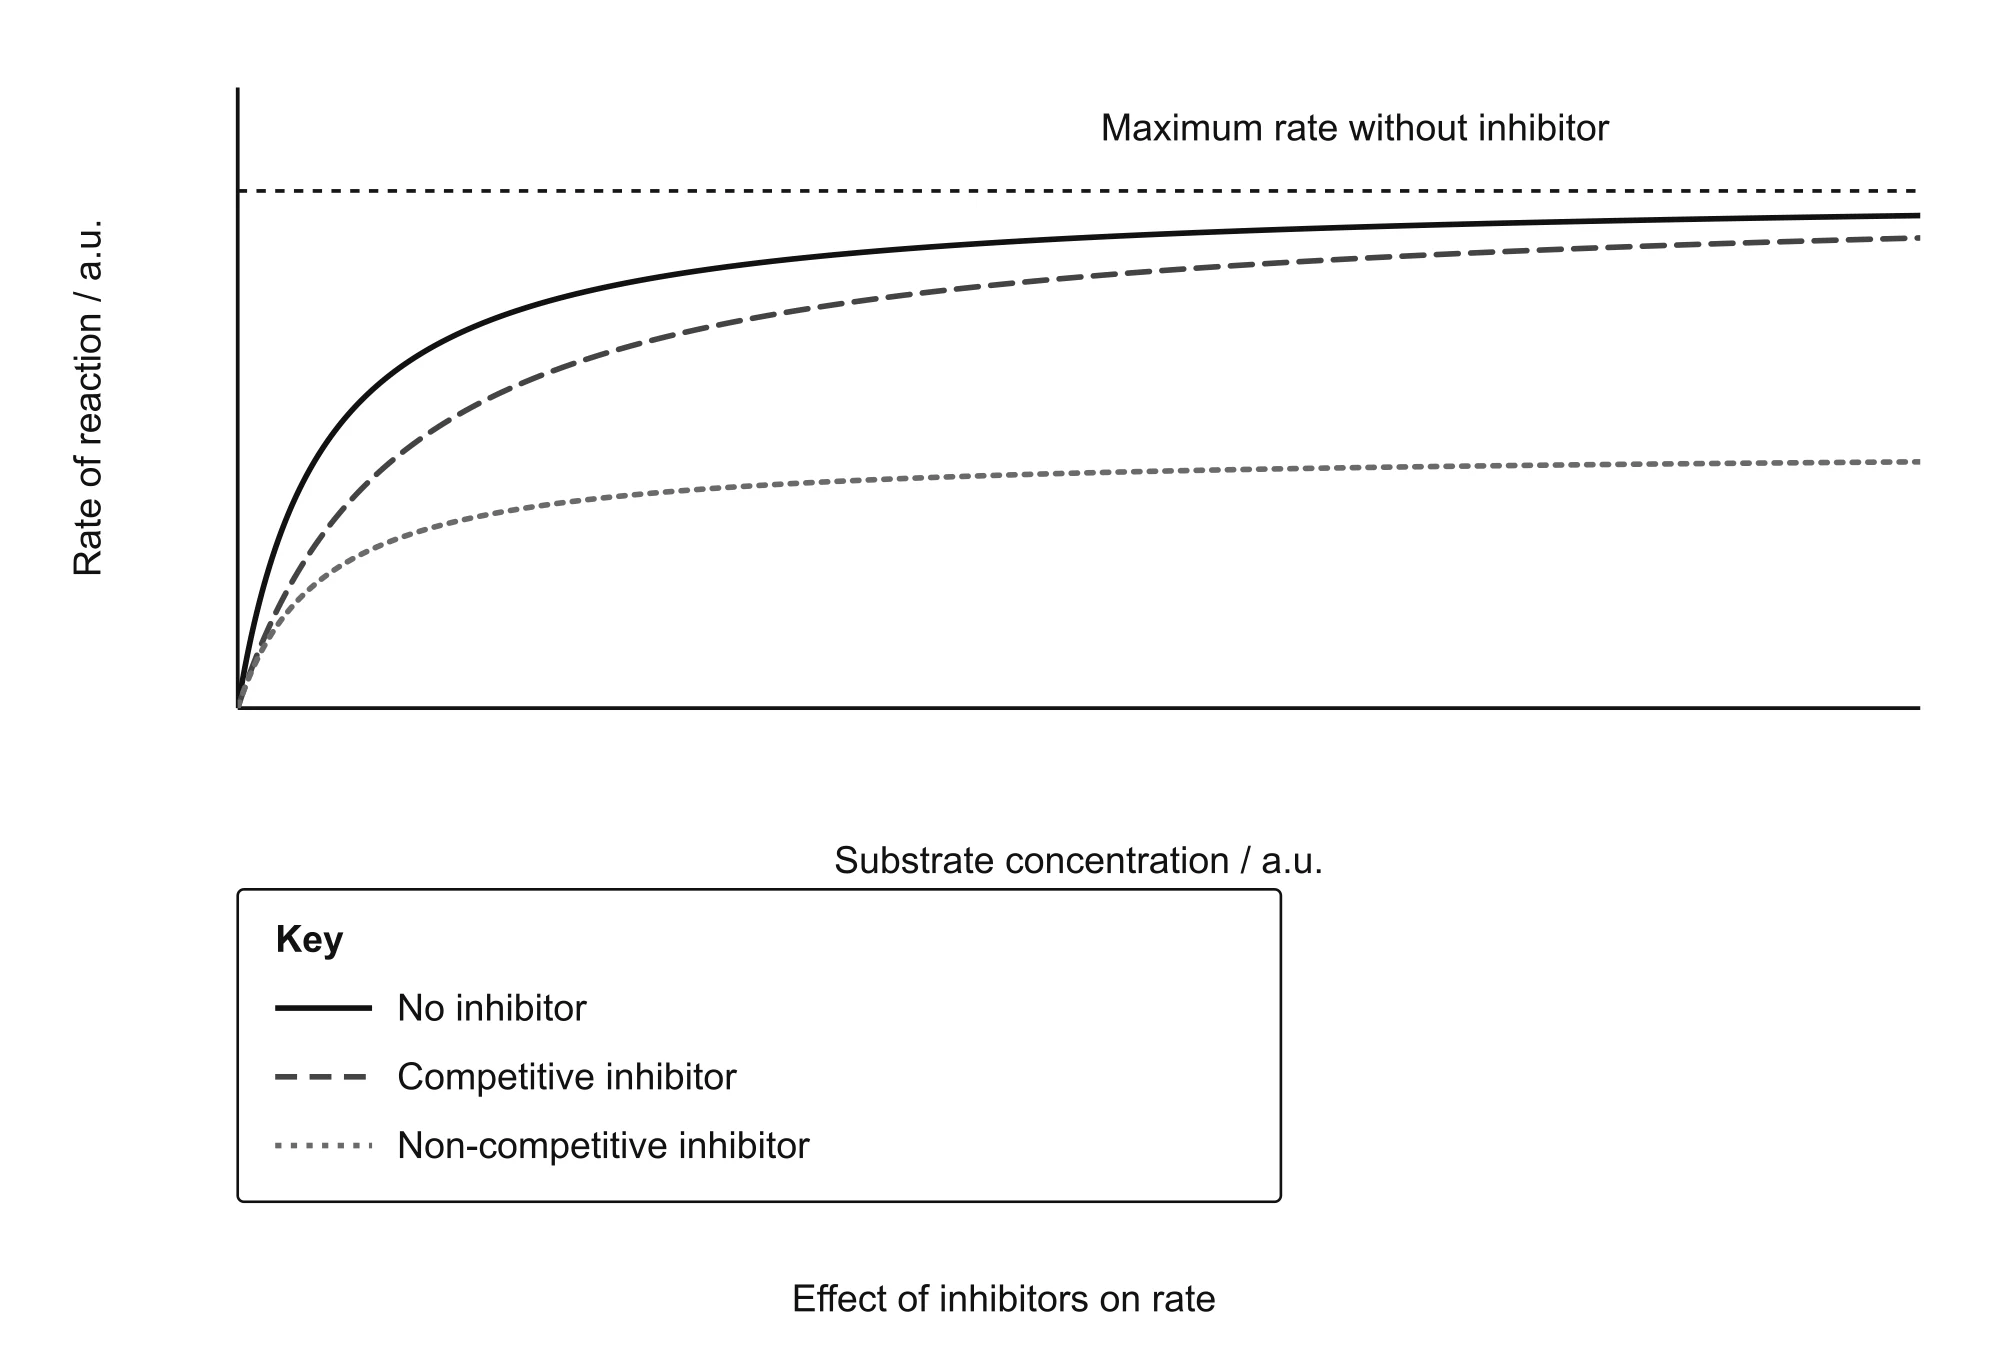
| Binds to | The | A site other than the |
| Shape | Similar to the , to the | Not similar to the |
| How it works | Blocks the from binding | Changes the , so the changes shape |
| More | Reduces the | Has no effect on the |
| Can still be reached | Lower |
 Open full size
 What are immobilised enzymes and why does industry use them?
are fixed in place, for example trapped in in a column, so they do not mix with the . Lactase in is used to make lactose-free milk, and glucose oxidase is used in glucose .
- The can be reused, which lowers costs.
- The is not contaminated with .
- The is more stable, so it is less easily by temperature or .
- The process can run continuously.
Specified practical work: enzyme investigations
You must be able to describe, analyse and evaluate both investigations: temperature or , and or concentration.
Investigating the effect of temperature or pH on enzyme activity
Unit 1, section 4, specified practical 1 (BioWelsh entry number) ↗To find out how temperature, or , affects the at which breaks down starch.
Equipment
- 1% starch solution and 1% solution (5 cm³ starch and 2 cm³ ): The and the , taken from the same stock solutions for every test.
- 7 (2 cm³): Keeps constant in the temperature version.
- Iodine solution and a spotting tile: Iodine turns blue-black if starch is still present.
- Thermostatically controlled and a thermometer: Keep each temperature constant and check it.
- Graduated pipettes, stopwatch and eye protection: Measure volumes accurately, time the reaction and protect the eyes.
Model answer: describe the method
Describe how you would carry out an investigation into the effect of temperature on the activity of amylase.
Original practice response · 6 indicative marks
- Use thermostatically controlled at five temperatures, such as 20, 30, 40, 50 and 60 °C.
- Measure 5 cm³ of starch with 2 cm³ of 7 , and separately 2 cm³ of , using graduated pipettes.
- Leave both tubes in the for 5 minutes to , then mix and start a stopwatch.
- Test a drop of the mixture with iodine every 30 seconds and record the time when it no longer turns blue-black.
- Keep constant with the and use the same volumes and concentrations of starch and in every test.
- Repeat three times at each temperature, calculate the time and the as 1 ÷ time, and use boiled and cooled as a .
What the answer needs to cover
- Range of temperatures using thermostatically controlled
- before mixing
- Valid measurement of the with iodine at regular intervals
- controlled with a and volumes and concentrations kept the same
- Repeats, and calculated
- Boiled and cooled as a
Method, step by step
- Put a drop of iodine in each well of a spotting tile.
- Put 5 cm³ starch with 2 cm³ 7 in one tube and 2 cm³ in another. Stand both in the for 5 minutes. Why: The solutions to the test temperature before the reaction starts.
- Mix the solutions, keep the tube in the and start the stopwatch.
- Every 30 seconds, put a drop of the mixture onto the iodine. Why: Blue-black means starch is still present.
- Record the time when the iodine no longer turns blue-black. This is the .
- Repeat three times at each of 20, 30, 40, 50 and 60 °C, calculate the time and then = 1 ÷ time.
- Set up a with boiled and cooled . Why: It shows that active breaks down the starch.
Variables
- : Temperature. 20 to 60 °C in 10 °C steps, using checked with a thermometer.
- : Time for starch to disappear, used to calculate . Sample onto iodine every 30 seconds. = 1 ÷ time.
- : . The same 7 in every tube, because changes the .
- : Volume and concentration of starch and of . Measured with graduated pipettes from the same stock solutions.
- comparison: Boiled and cooled . The iodine should stay blue-black, showing that active causes the change.
Switching to the pH version
- Use one at a constant temperature, so temperature becomes a .
- Use of different , such as 4 to 9, as the .
- Expect a peak at the with the falling on both sides.
Results and analysis
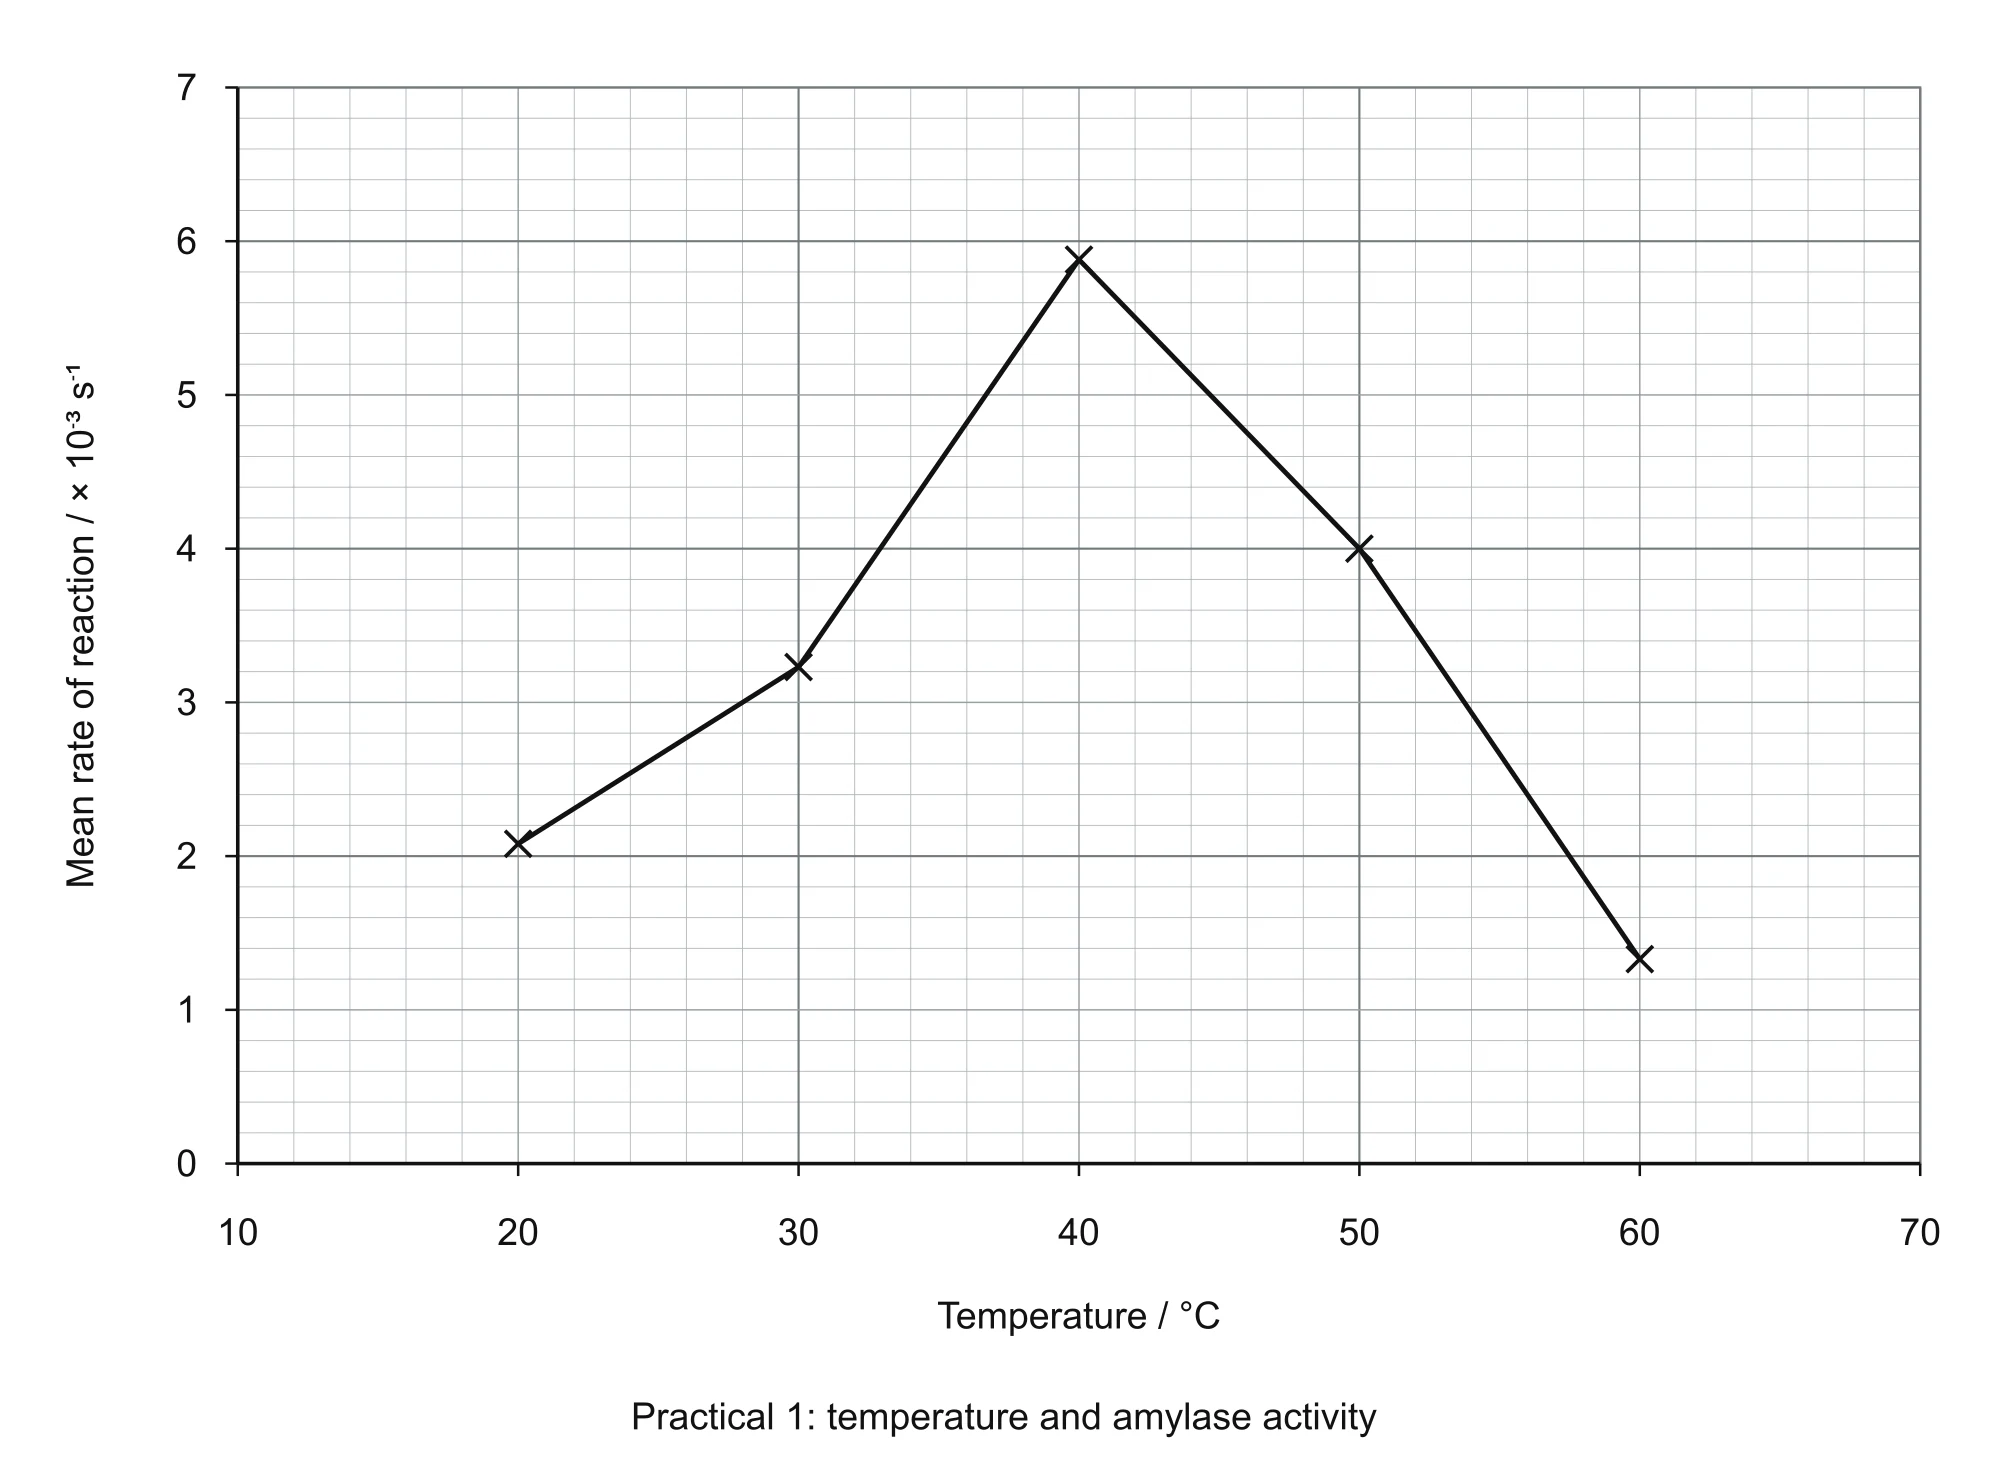
Any example results below are illustrative. The rises from 2.08 × 10⁻³ s⁻¹ at 20 °C to a peak of 5.88 × 10⁻³ s⁻¹ at 40 °C, then falls to 1.33 × 10⁻³ s⁻¹ at 60 °C. The rise is caused by increasing and more . The fall is caused by , as the changes shape. The is about 40 °C, but it could lie between 30 °C and 50 °C because readings were taken every 10 °C. at 40 °C = 1 ÷ 170 = 5.88 × 10⁻³ s⁻¹
Evaluation
Samples taken only every 30 seconds. The is only known to the nearest 30 seconds. Improvement: Sample more often or use a . Judging the colour change is subjective. may be inconsistent. Improvement: Use a colour standard or a . Temperatures 10 °C apart. The cannot be found precisely. Improvement: Use smaller intervals between 30 °C and 50 °C.
Safety
Iodine solution: Irritates eyes and stains skin. : Wear eye protection and wash off spills. Hot and boiling the : Scalds and burns. : Use a test tube holder or tongs and keep hands out of hot water.
Exam practice
Explain why the solutions were left in the water bath for 5 minutes before mixing.
So that both solutions were at the test temperature, and had the same , before the reaction started. Both solutions reach the test temperature before mixing
Scroll sideways to view all columns.
| Temperature / °C | Trial 1 time / s | Trial 2 time / s | Trial 3 time / s | Mean time / s | Mean rate / × 10⁻³ s⁻¹ |
|---|---|---|---|---|---|
| 20 | 480 | 510 | 450 | 480 | 2.08 |
| 30 | 300 | 330 | 300 | 310 | 3.23 |
| 40 | 180 | 150 | 180 | 170 | 5.88 |
| 50 | 240 | 270 | 240 | 250 | 4.00 |
| 60 | 720 | 780 | 750 | 750 | 1.33 |
 Open full size
 Investigating the effect of enzyme or substrate concentration on enzyme activity
Unit 1, section 4, specified practical 2 (BioWelsh entry number) ↗To find out how concentration, or concentration, affects the activity of , using potato extract and hydrogen peroxide.
Equipment
- 20 vol hydrogen peroxide and distilled water: The , diluted to make a range of concentrations.
- Potato extract made in 7 : The source of , with kept constant.
- Filter paper discs cut with a hole punch, and forceps: Carry the same amount of into each tube.
- Identical boiling tubes holding 20 cm³: Keep the depth of liquid the same.
- at 25 °C, stopwatch, graduated pipettes, eye protection and gloves: temperature, time each disc, measure volumes and stay safe.
Model answer: describe the method
Describe how you would investigate the effect of hydrogen peroxide concentration on the activity of catalase using filter paper discs.
Original practice response · 6 indicative marks
- Dilute 20 vol hydrogen peroxide with water to make at least five concentrations, keeping the total volume at 20 cm³ in identical tubes.
- Make potato extract in 7 and keep all solutions in a at 25 °C.
- Soak same size discs in the extract for 10 seconds and drain for 5 seconds.
- Drop each disc into the hydrogen peroxide and time how long it takes to sink and rise.
- Repeat three times at each concentration with fresh solution and calculate the time and as 1 ÷ time.
- Use discs soaked in boiled and cooled extract as a .
What the answer needs to cover
- Range of concentrations made by
- Equal discs soaked for a fixed time
- Time to sink and rise measured
- Temperature and controlled
- Repeats, and calculated
- Boiled and cooled extract as a
Method, step by step
- Make 20 cm³ each of 4, 8, 12, 16 and 20 vol hydrogen peroxide by diluting the 20 vol stock with water.
- the tubes and potato extract in a at 25 °C.
- Soak a disc in extract for 10 seconds and drain it for 5 seconds. Why: Each disc then carries a similar amount of .
- Drop the disc into the solution and time how long it takes to sink and rise. Why: Oxygen released by makes the disc rise.
- Repeat three times with a fresh disc and fresh solution, then calculate the time and = 1 ÷ time.
- Use discs soaked in boiled and cooled extract as a . Why: They should not rise.
Variables
- : Hydrogen peroxide concentration. 4 to 20 vol, made by .
- : Time for the disc to sink and rise, used to calculate . Timed with a stopwatch. = 1 ÷ time.
- : Temperature and . A at 25 °C and extract made in 7 .
- : Amount of on each disc and depth of solution. Same size discs, same soaking time and 20 cm³ in identical tubes.
- comparison: Boiled and cooled extract. Discs should not rise, showing that active produces the oxygen.
Switching to the enzyme concentration version
- Keep the hydrogen peroxide at 20 vol so is in excess.
- Dilute the potato extract with 7 to make 20, 40, 60, 80 and 100% extract.
- Expect a straight line, because more gives more .
Results and analysis
Any example results below are illustrative. The increases from 3.13 × 10⁻² s⁻¹ at 4 vol to 7.14 × 10⁻² s⁻¹ at 12 vol, then levels off at about 8.5 × 10⁻² s⁻¹. At first is the . At high concentrations all are occupied, so concentration is . In the concentration version, increases in direct proportion to extract concentration while is in excess. at 20 vol = 1 ÷ 11.7 = 8.55 × 10⁻² s⁻¹
Evaluation
Discs may carry different amounts of extract. Times vary for reasons other than concentration. Improvement: Use identical discs with fixed soaking and draining times. Temperature not controlled if done on the bench. changes with room temperature. Improvement: Use a . Reusing the same solution for repeats. is partly used up. Improvement: Use fresh solution for each repeat.
Safety
Hydrogen peroxide: Irritates eyes and skin. : Wear eye protection and gloves and rinse splashes with water. Blender and knife: Cuts. : Cut on a tile and unplug the blender before handling the blades.
Exam practice
Explain why the rate levels off at high hydrogen peroxide concentrations.
At high concentrations all the of are occupied, so concentration is the and adding more does not increase the . All occupied concentration is the
Scroll sideways to view all columns.
| Concentration of hydrogen peroxide / vol | Trial 1 time / s | Trial 2 time / s | Trial 3 time / s | Mean time / s | Mean rate / × 10⁻² s⁻¹ |
|---|---|---|---|---|---|
| 0 (distilled water) | no rise in 120 s | no rise in 120 s | no rise in 120 s | not calculated | 0 |
| 4 | 32 | 35 | 29 | 32.0 | 3.13 |
| 8 | 18 | 20 | 19 | 19.0 | 5.26 |
| 12 | 13 | 15 | 14 | 14.0 | 7.14 |
| 16 | 12 | 13 | 11 | 12.0 | 8.33 |
| 20 | 12 | 11 | 12 | 11.7 | 8.55 |
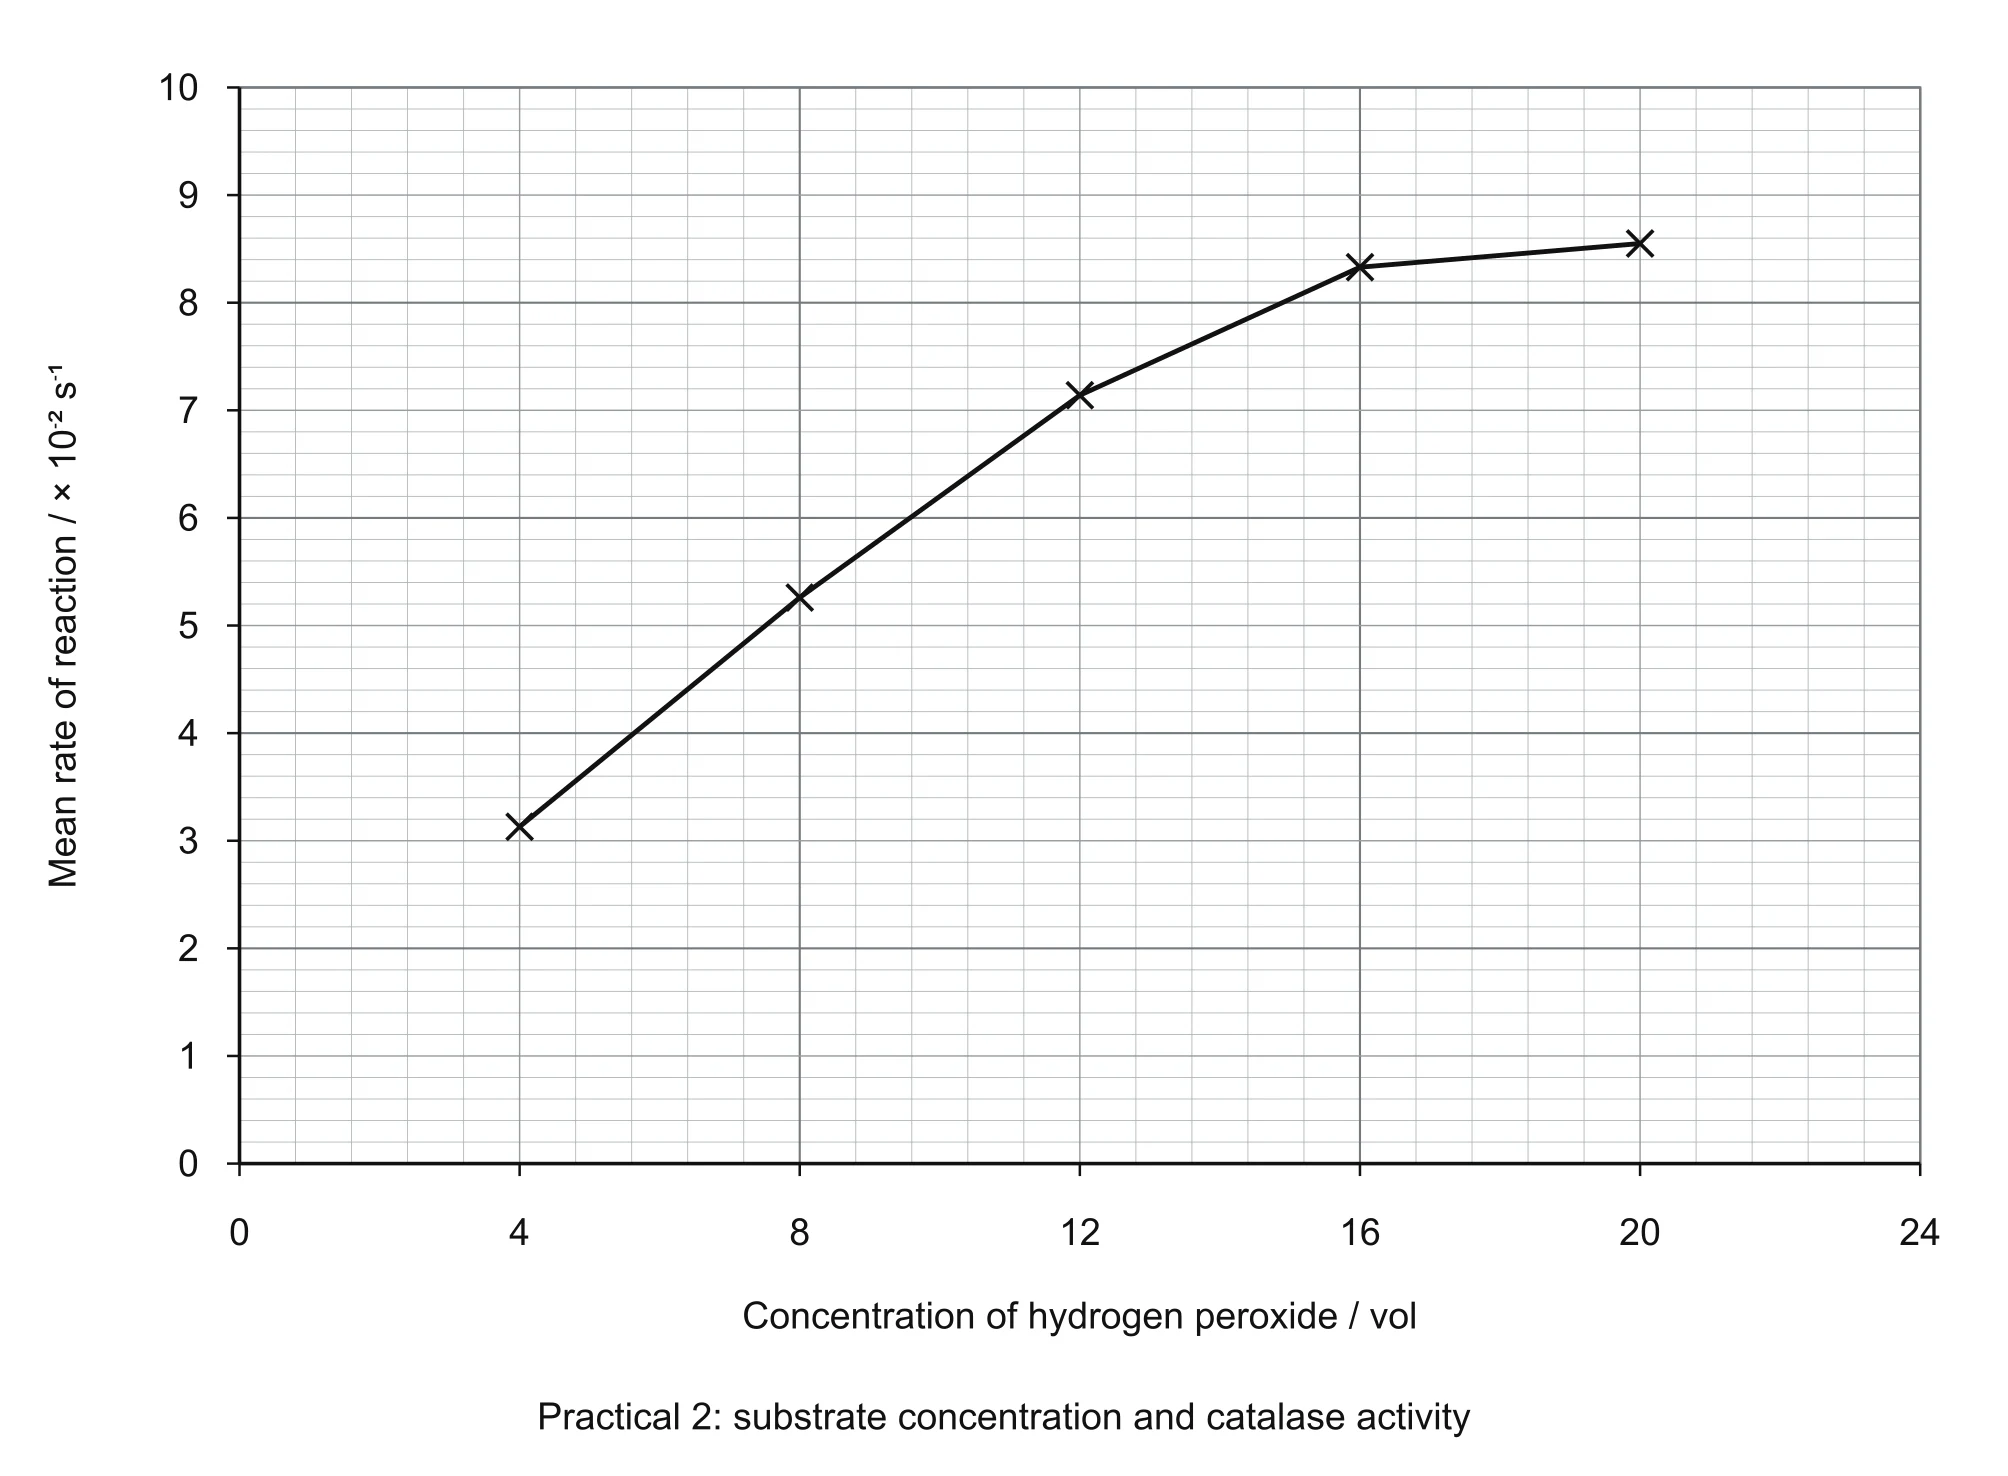 Open full size
 Enzymes summary: everything in one place
The whole topic as one chain
- 1.
- 2.
- 3. shaped
- 4. binds
- 5.
- 6. Lower
- 7. released
- are , not killed, and cold temperatures make them rather than .
- The is to the , not the same shape as it.
- A keeps temperature constant; a keeps constant.
- A levelled-off is constant, not stopped.
- A and a are different things.
Check your understanding.
One question at a time. Check your reasoning before moving on.
The flow below shows part of a metabolic pathway in a yeast cell. A mutation means the cell can no longer make a functional version of enzyme 2. Which statement describes the most likely effect on the pathway?
- A metabolic pathway in a yeast cell
- Substance P
- Enzyme 1 converts P into Q
- Enzyme 2 converts Q into R
- Enzyme 3 converts R into S
1 mark
Need a refresher? Read the full explanation ↗Your answers stay in this tab while this page is open.